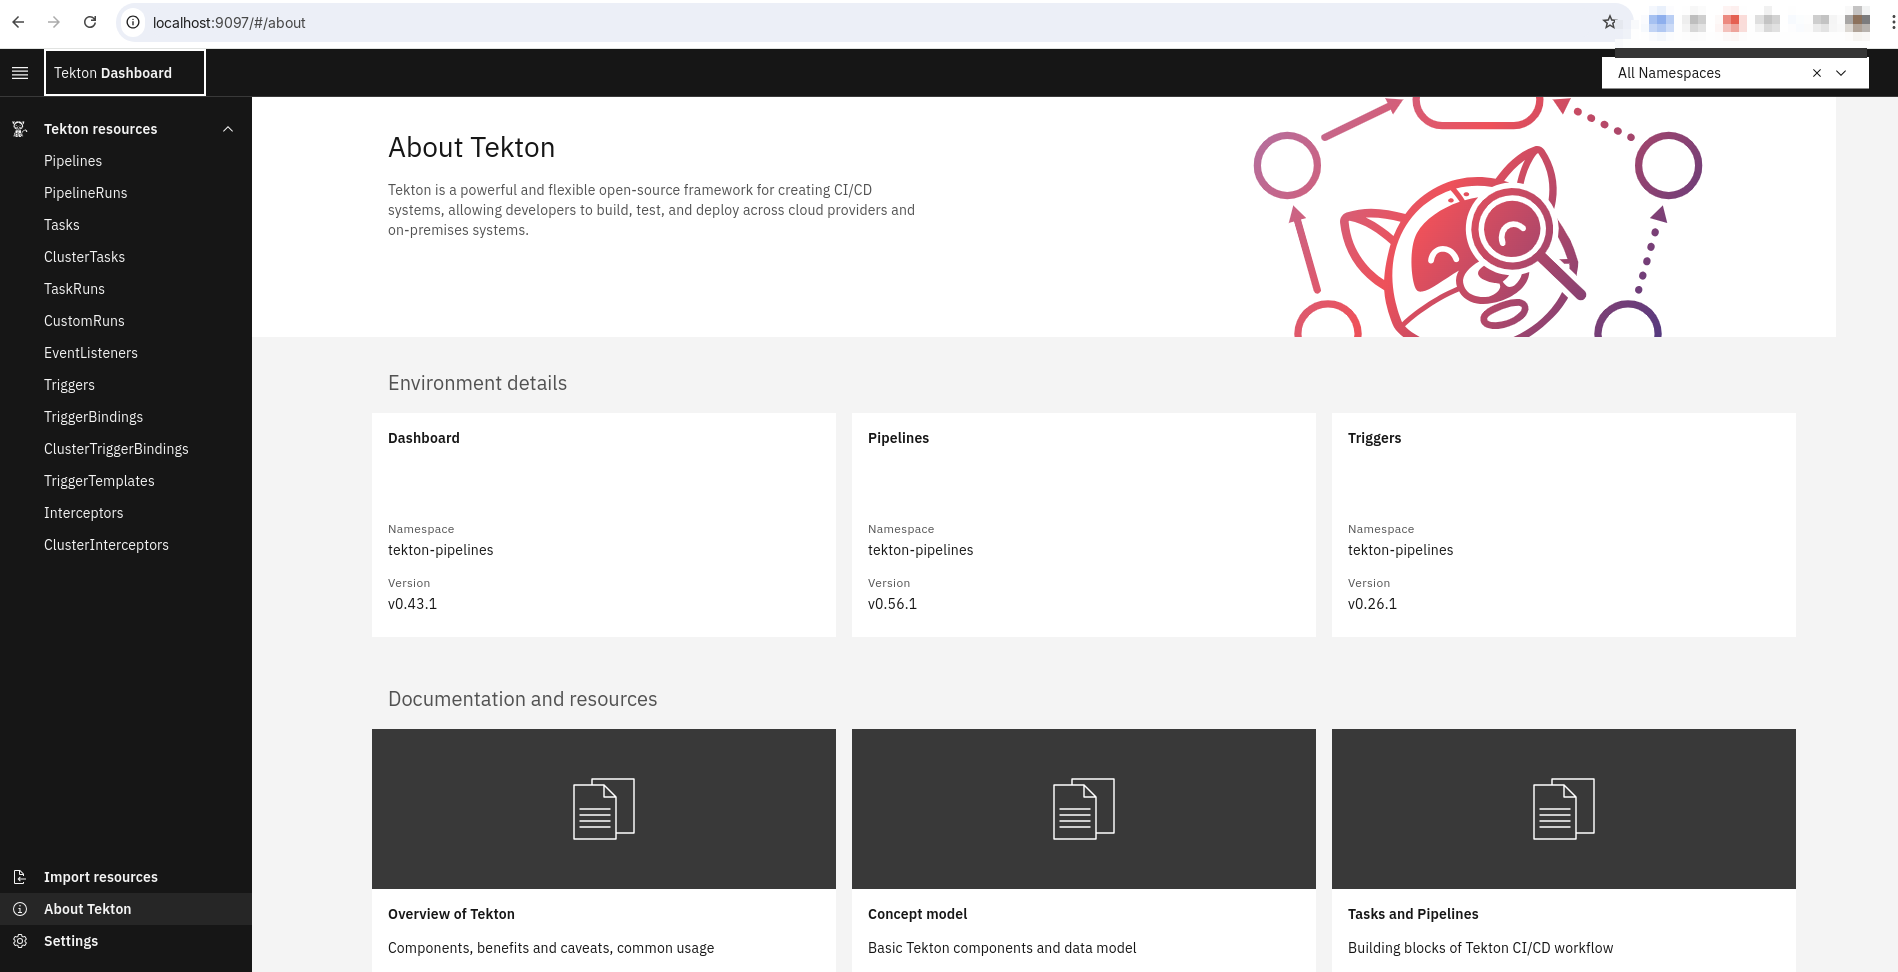
Dashboard
Vamos conferir um pouco do dashboard. Vamos encontrar o serviço e expor a porta
k get svc -n tekton-pipelines
NAME                                TYPE        CLUSTER-IP       EXTERNAL-IP   PORT(S)                              AGE
tekton-chains-metrics               ClusterIP   10.97.25.22      <none>        9090/TCP                             10h
tekton-dashboard                    ClusterIP   10.100.96.146    <none>        9097/TCP                             10h
tekton-events-controller            ClusterIP   10.105.115.210   <none>        9090/TCP,8008/TCP,8080/TCP           10h
tekton-operator-proxy-webhook       ClusterIP   10.102.16.99     <none>        443/TCP                              10h
tekton-pipelines-controller         ClusterIP   10.96.179.193    <none>        9090/TCP,8008/TCP,8080/TCP           10h
tekton-pipelines-remote-resolvers   ClusterIP   10.104.95.223    <none>        9090/TCP,8008/TCP,8080/TCP           10h
tekton-pipelines-webhook            ClusterIP   10.106.146.247   <none>        9090/TCP,8008/TCP,443/TCP,8080/TCP   10h
tekton-triggers-controller          ClusterIP   10.110.79.44     <none>        9000/TCP                             10h
tekton-triggers-core-interceptors   ClusterIP   10.96.76.242     <none>        8443/TCP                             10h
tekton-triggers-webhook             ClusterIP   10.109.205.230   <none>        443/TCP                              10h

# Observamos acima que o dashboard atende na porta 9097 então vamos fazer um port-forward local para ter acesso em localhost:9097
k -n tekton-pipelines port-forward svc/tekton-dashboard 9097:9097
Forwarding from 127.0.0.1:9097 -> 9097
Forwarding from [::1]:9097 -> 9097
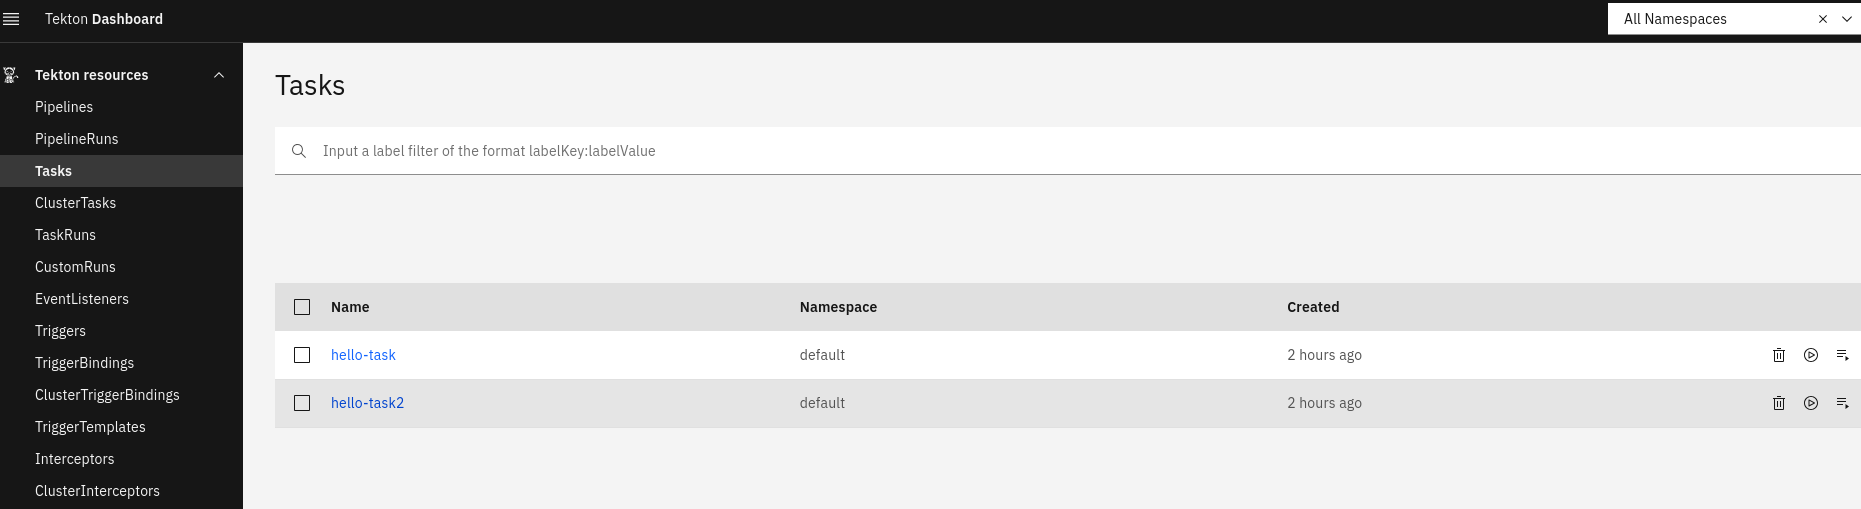
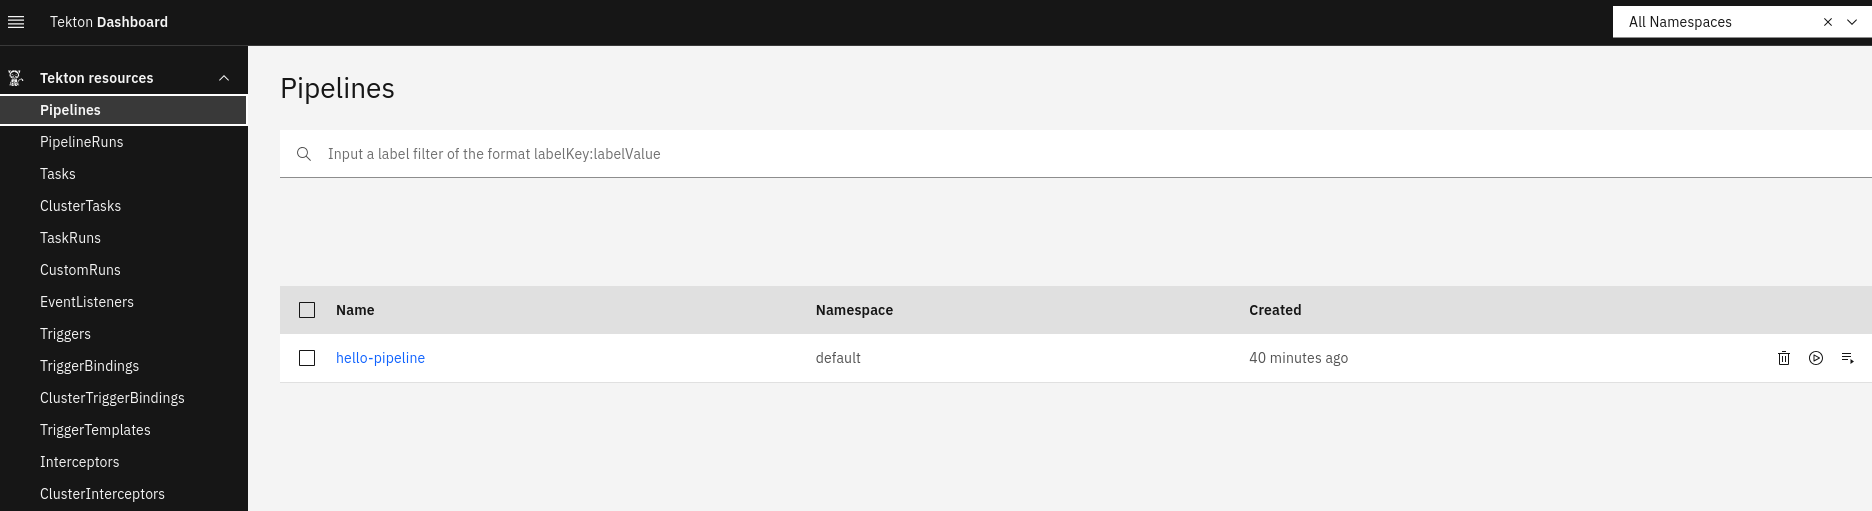
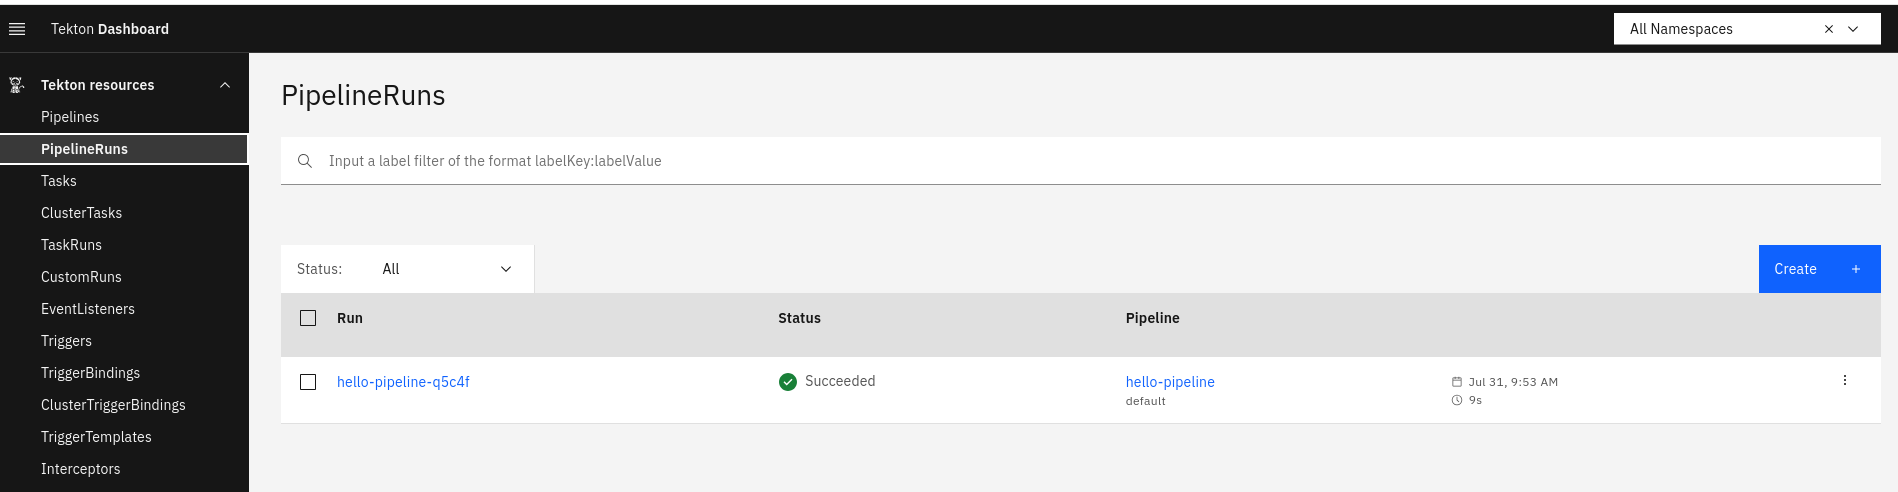
Vamos ver as tasks, tasksrun, pipeline, pipelinerun e outros filtrando inclusive por namespace
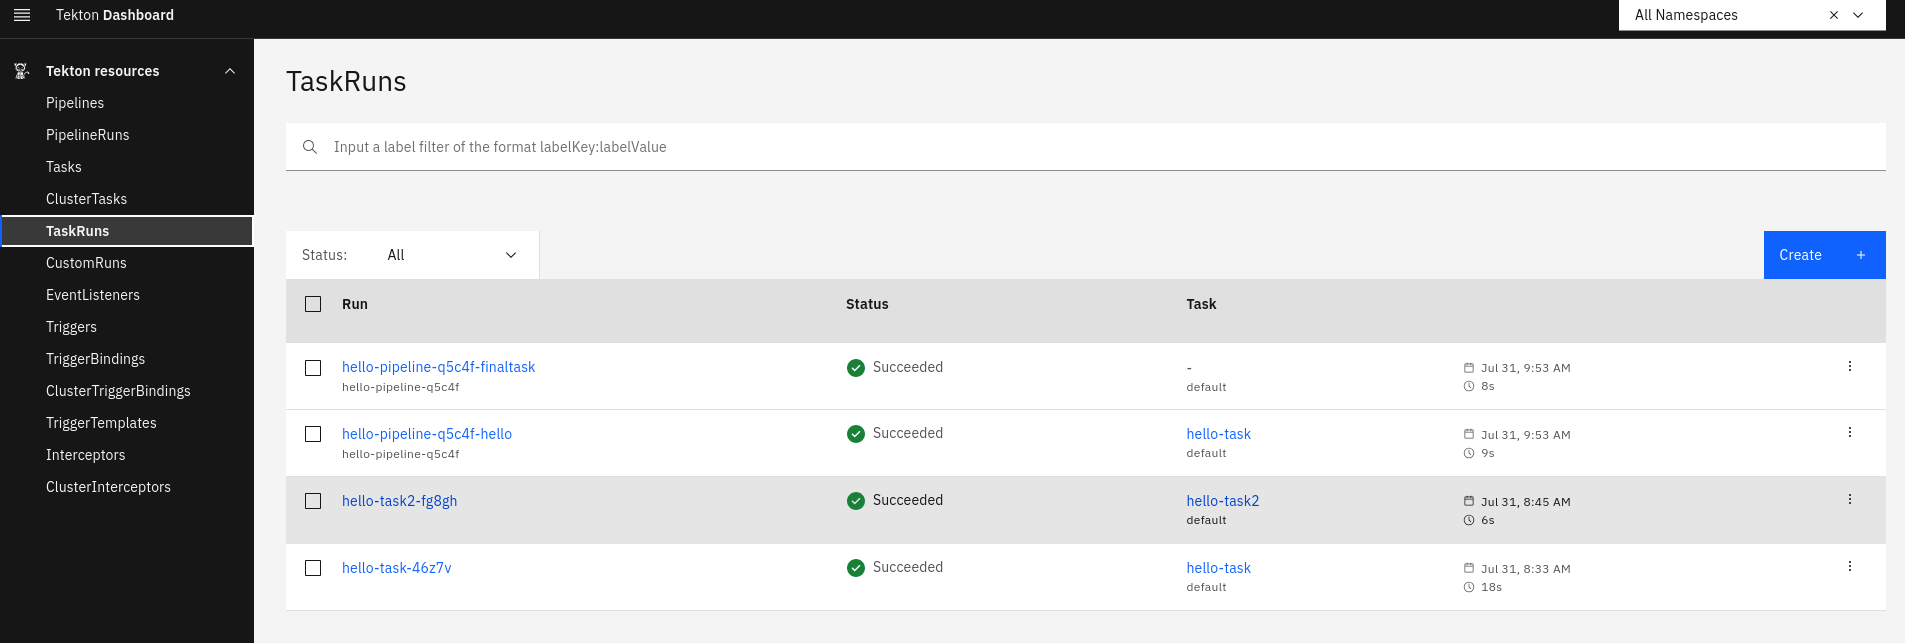
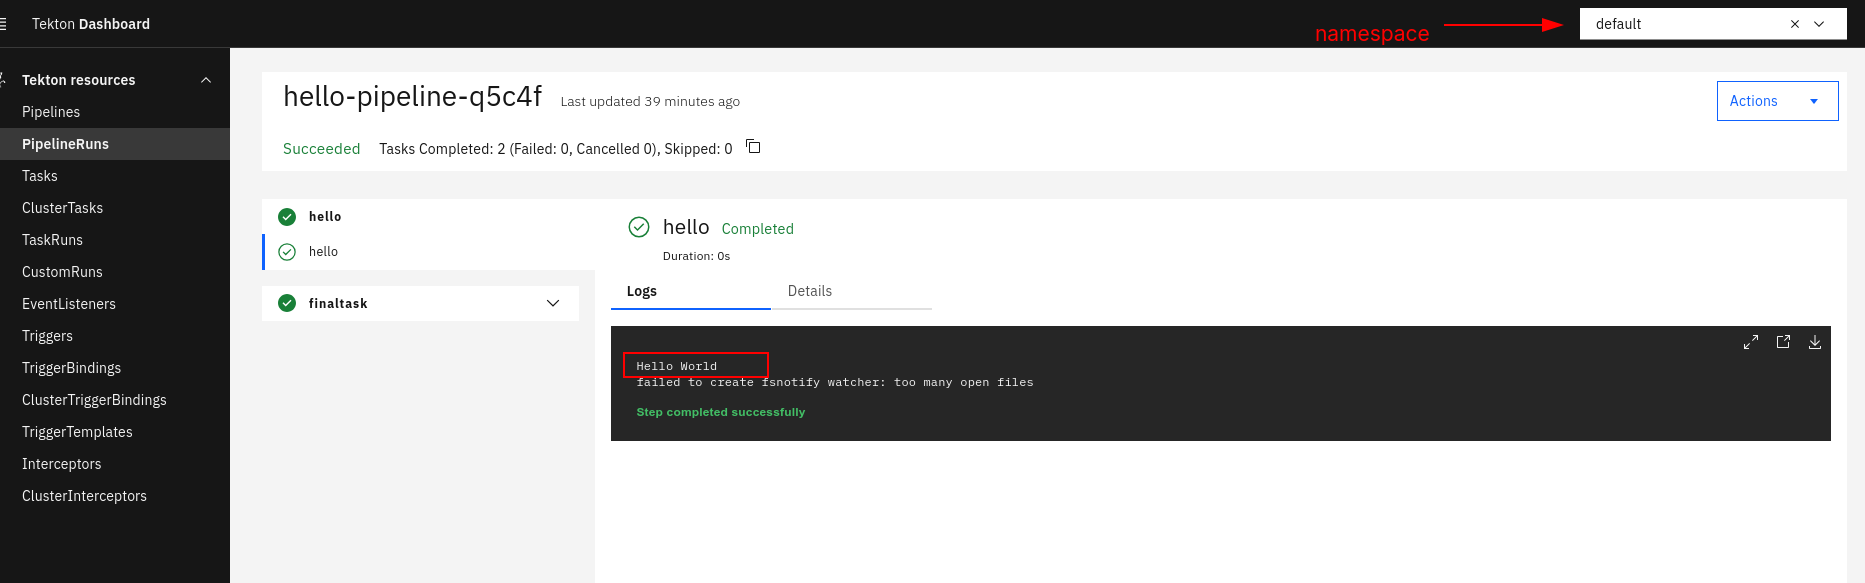
Podemos conferir os logs inclusive por namespace.
Por enquanto não é possível criar ou editar pipelines visualmente, mas é possível visualizar os yamls. É possível criar pipelineRun e taskRun com algumas limitações.
Vou colocar aqui como débito técnico entender um pouco das limitações do dashboard.