Prometheus Installation
Initially, the installation of Prometheus is just Prometheus itself and not the complete stack with Grafana and AlertManager, which are separate services, and this should be very clear.
Grafana can be configured with a data input coming from Prometheus, just as AlertManager is also configured so that Prometheus sends alerts to it.
Local installation
On the release page, we can download the Prometheus project. https://github.com/prometheus/prometheus/releases/
# Creating prometheus service user and group
sudo groupadd --system prometheus
sudo useradd -s /sbin/nologin --system -g prometheus

# Creating directory tree in /etc/prometheus
# /etc/prometheus/files_sd
# /etc/prometheus/rules
# /etc/prometheus/rules.d
for i in rules rules.d files_sd; do sudo mkdir -p /etc/prometheus/${i}; done

# Downloading prometheus to /tmp/prometheus
mkdir -p /tmp/prometheus && cd /tmp/prometheus
curl -s https://api.github.com/repos/prometheus/prometheus/releases/latest | grep browser_download_url | grep linux-amd64 | cut -d '"' -f 4 | wget -qi -

# unzip
tar xvf prometheus*.tar.gz
# Moving binary to system path
cd prometheus*/
sudo mv prometheus promtool /usr/local/bin/
# Moving configuration file and folders to /etc/prometheus
sudo mv prometheus.yml /etc/prometheus/prometheus.yml
sudo mv consoles/ console_libraries/ /etc/prometheus/

# Fixing permissions
sudo mkdir /var/lib/prometheus
sudo chown -R prometheus:prometheus /etc/prometheus/
sudo chmod -R 775 /etc/prometheus/
sudo chown -R prometheus:prometheus /var/lib/prometheus/
sudo chown -R prometheus:prometheus /var/log/prometheus/

# Deleting temporary files
rm -rf /tmp/prometheus

prometheus --version
promtool --version

# If necessary, change the configuration file at /etc/prometheus/prometheus.yml

# Creating the service
sudo tee /etc/systemd/system/prometheus.service<<EOF
[Unit]
Description=Prometheus
Documentation=https://prometheus.io/docs/introduction/overview/
Wants=network-online.target
After=network-online.target
ConditionFileNotEmpty=/etc/prometheus/prometheus.yml

[Service]
Type=simple
User=prometheus
Group=prometheus
ExecReload=/bin/kill -HUP \$MAINPID
ExecStart=/usr/local/bin/prometheus \
  --config.file=/etc/prometheus/prometheus.yml \
  --storage.tsdb.path=/var/lib/prometheus \
  --web.console.templates=/etc/prometheus/consoles \
  --web.console.libraries=/etc/prometheus/console_libraries \
  --web.listen-address=0.0.0.0:9090 \
  --web.external-url=
SyslogIdentifier=prometheus
Restart=always
pid_file="/var/lib/prometheus/prometheus.pid"
StandardOutput=append:/var/log/prometheus/output.log
StandardError=append:/var/log/prometheus/error.log

[Install]
WantedBy=multi-user.target
EOF

# Opening port 9090 in firewall
sudo ufw allow 9090/tcp

# Enabling the service
sudo systemctl daemon-reload
sudo systemctl enable prometheus --now
sudo systemctl status prometheus
In theory, Prometheus is now installed and responding on localhost:9090, but it's not collecting any metrics yet. However, if you want to install Prometheus on your Linux machine, it doesn't have native integration for Prometheus to fetch metrics. That's why we need a node exporter. In this case, it's the service that will read Linux's /proc and make it available formatted for Prometheus to collect.
sudo useradd -M -r -s /bin/false node_exporter
mkdir -p /tmp/node_exporter && cd /tmp/node_exporter
curl -s https://api.github.com/repos/prometheus/node_exporter/releases/latest| grep browser_download_url| grep linux-amd64| cut -d '"' -f 4| wget -qi -
tar -xvf node_exporter*.tar.gz
cd  node_exporter*/
sudo cp node_exporter /usr/local/bin
node_exporter --version

cat << EOF | sudo tee /etc/systemd/system/node_exporter.service
[Unit]
Description=Node Exporter
Wants=network-online.target
After=network-online.target

[Service]
User=node_exporter
ExecStart=/usr/local/bin/node_exporter

[Install]
WantedBy=default.target
EOF

sudo ufw allow 9100

sudo systemctl daemon-reload
sudo systemctl enable node_exporter --now
sudo systemctl status node_exporter.service
We have the node exporter running, but Prometheus doesn't yet know that it needs to scrape the node exporter. It's necessary to modify the Prometheus configuration at /etc/prometheus/prometheus.yml.
We need to add a job in Prometheus in the scrape_config tag as shown below:
...
scrape_configs:
  # The job name is added as a label `job=<job_name>` to any timeseries scraped from this config.
  - job_name: 'prometheus'

    # metrics_path defaults to '/metrics'
    # scheme defaults to 'http'.

    static_configs:
    - targets: ['localhost:9090']

####### This part #######
  - job_name: david-pc
    static_configs:
      - targets: ['localhost:9100']
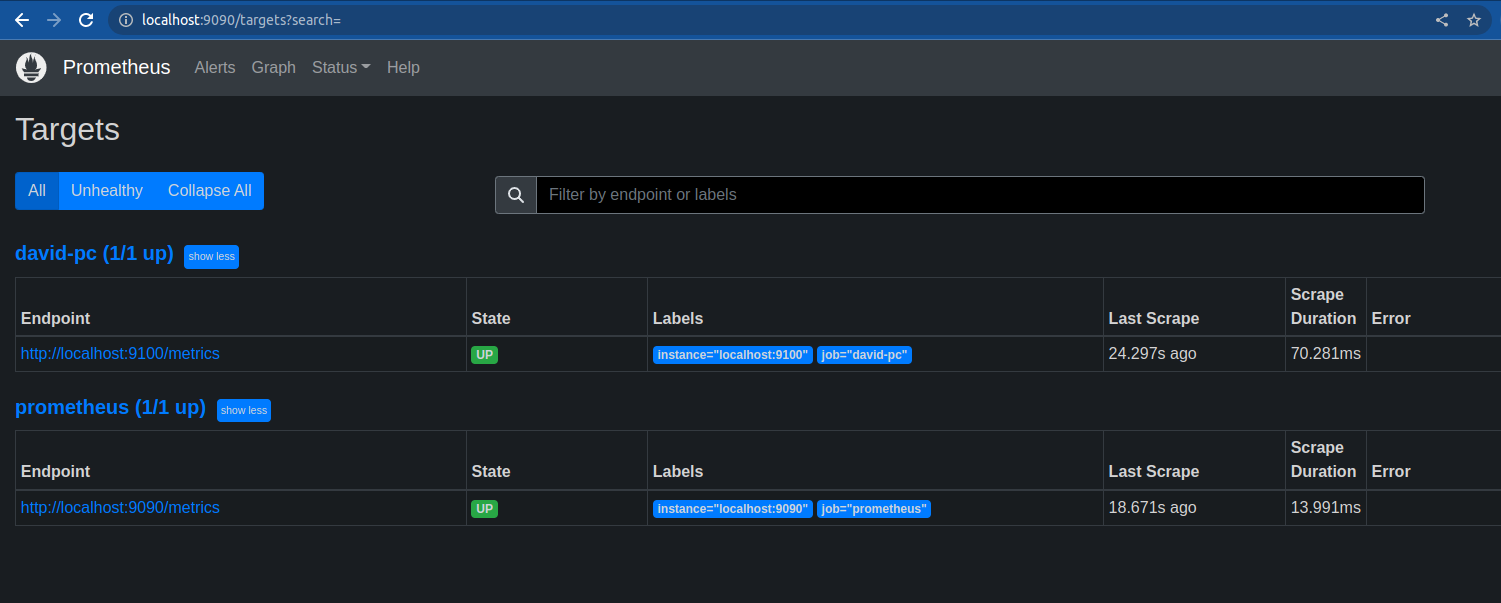
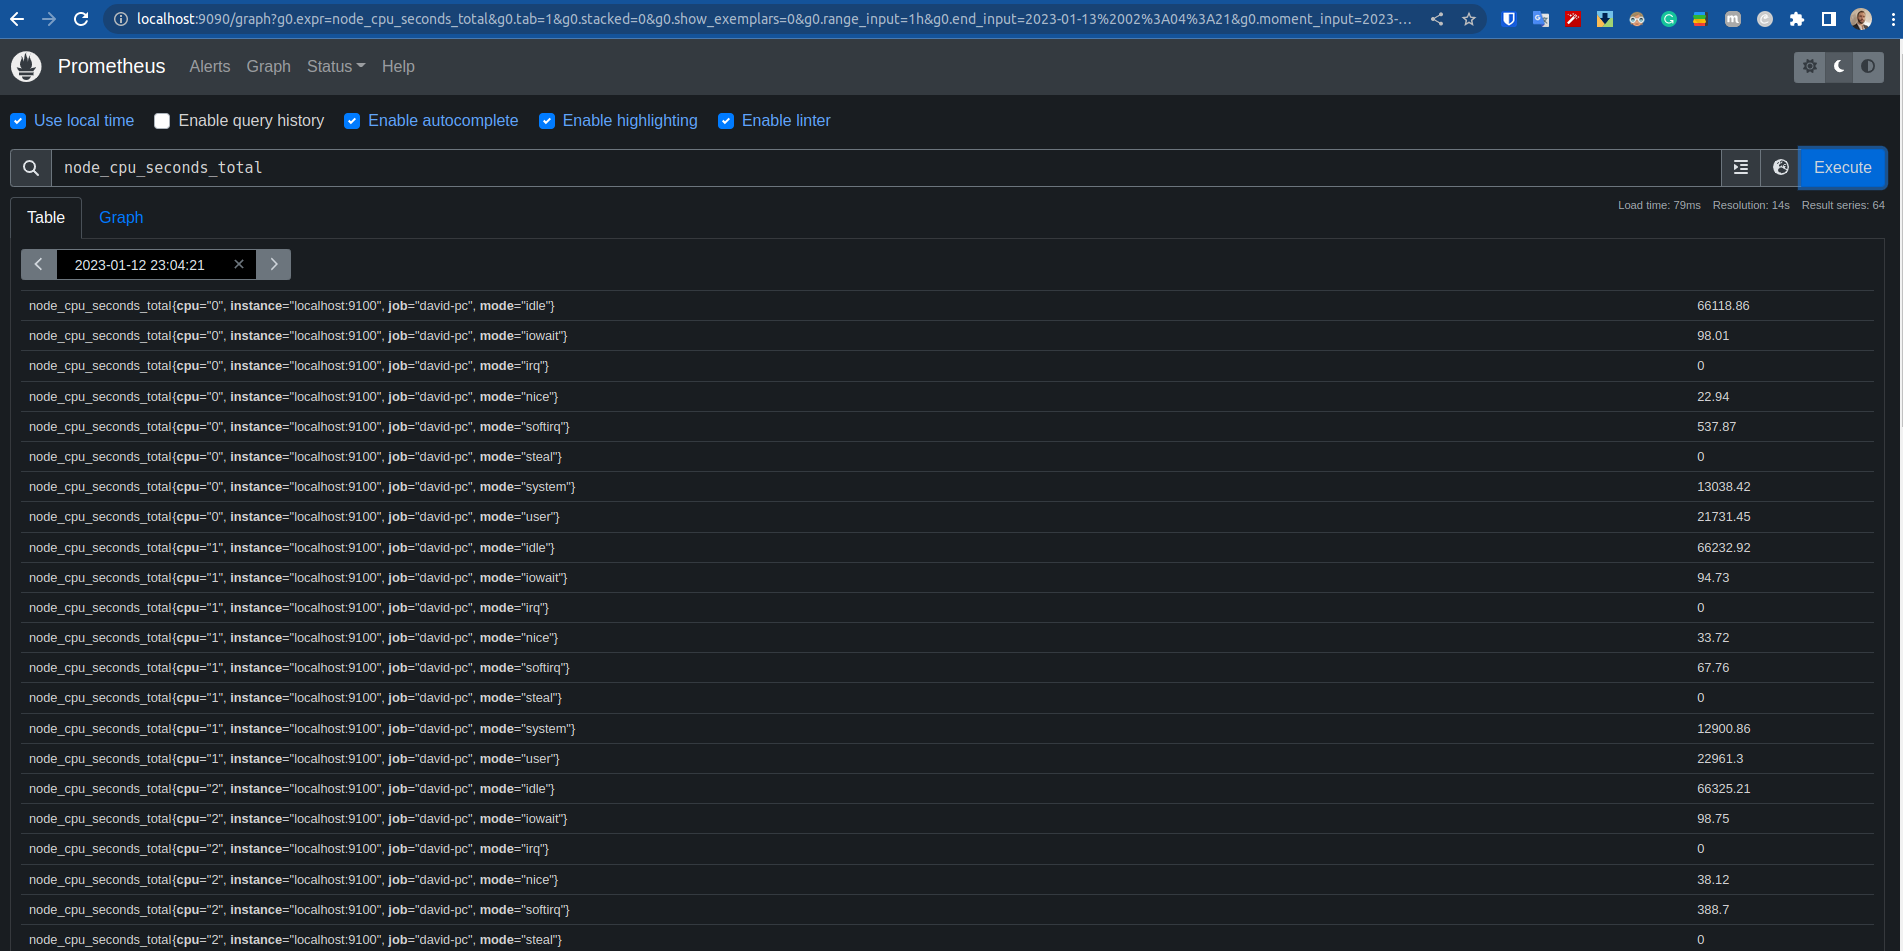
Now restart Prometheus so it picks up the configurations.
sudo systemctl restart prometheus
Docker installation
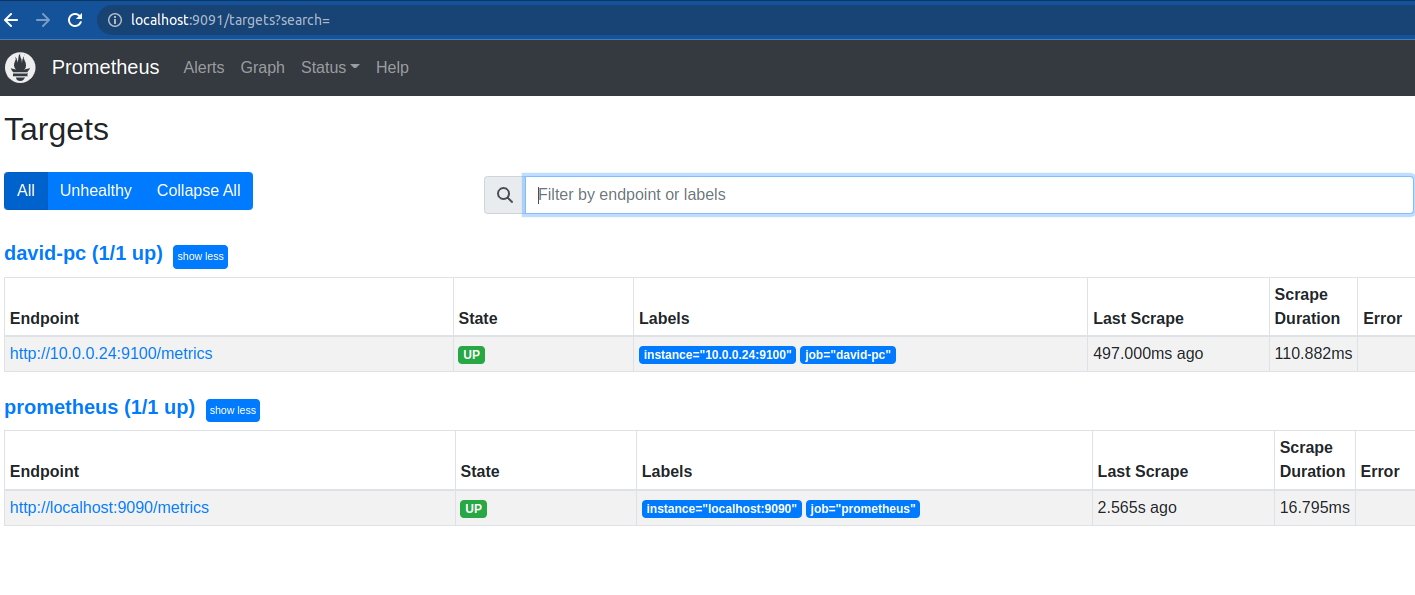
To install via Docker, once we already have a configuration file and a node exporter installed locally, we can just run the service on another port for testing. However, this time we need to specify the IP, as localhost won't work.
# -v source_path:/etc/prometheus/prometheus.yml
# -p port
# Remember to change the file /docs/monitoring/prometheus/resources/prometheus.yml to your machine's IP
docker run \
    -p 9091:9090 \
    -v /home/dprata/Desktop/personal/study-prometheus//docs/monitoring/prometheus/resources/prometheus.yml:/etc/prometheus/prometheus.yml \
    prom/prometheus
Kubernetes installation
https://github.com/prometheus-community/helm-charts/tree/main/charts/kube-prometheus-stack
For Kubernetes, we will install Prometheus using Helm with a chart that installs a complete Prometheus stack with AlertManager and Grafana.
You need to have a Kubernetes cluster and Helm installed.
helm repo add prometheus-community https://prometheus-community.github.io/helm-charts
helm repo update
We will just install the default without changing anything, as we will configure this better later on.
helm install prometheus-stack prometheus-community/kube-prometheus-stack --create-namespace --namespace monitoring

kubectl get pods -n monitoring
NAME                                                     READY   STATUS    RESTARTS   AGE
prometheus-stack-prometheus-node-exporter-mbfkh          1/1     Running   0          34s
prometheus-stack-prometheus-node-exporter-28ct7          1/1     Running   0          34s
prometheus-stack-prometheus-node-exporter-5s75j          1/1     Running   0          34s
prometheus-stack-grafana-bd7d589f-ch6sg                  3/3     Running   0          34s
prometheus-stack-kube-prom-operator-947444c9b-vpg4d      1/1     Running   0          34s
prometheus-stack-kube-state-metrics-676cffd69c-tjxgp     1/1     Running   0          34s
alertmanager-prometheus-stack-kube-prom-alertmanager-0   2/2     Running   0          29s
prometheus-prometheus-stack-kube-prom-prometheus-0       2/2     Running   0          29s
Note that we have 3 node exporters, one for each node of the cluster I have.
Extras
Additional reading from books?
- book install.
- book expressions
- Do some tests on your installation.