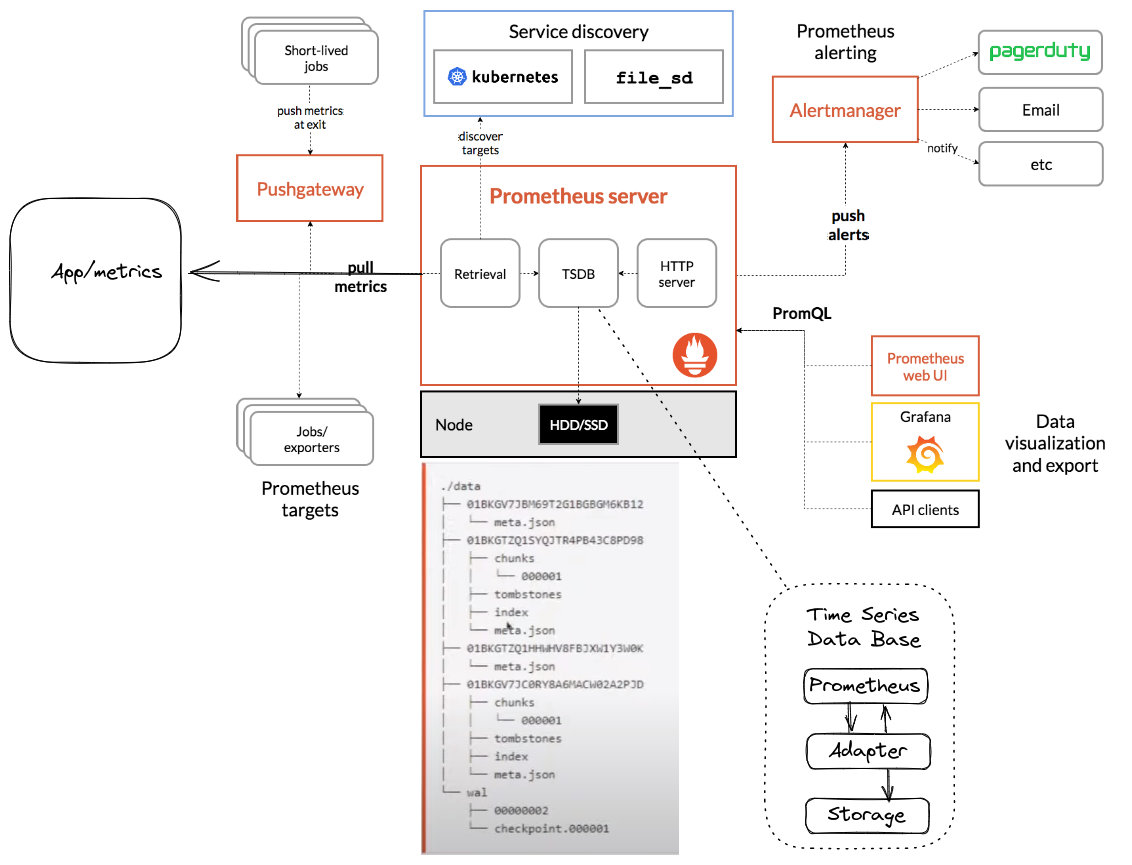
Prometheus Architecture
Prometheus works actively - it goes to an endpoint exposed by the application to fetch metrics through pull. However, these metrics must be correctly formatted to enter the TSDB (Time Series Database).
Generally, in other tools, it's the application that sends data through a push.
Prometheus Server
Inside the Prometheus server, we have the following elements:
- TSDB
- Retrieval
- HTTP (PromQL)
TSDB (Time Series Database)
https://prometheus.io/docs/prometheus/latest/storage/
It is used to store metrics data.
Prometheus includes a local on-disk time series database, but also optionally integrates with remote storage systems.
Prometheus by default (can be configured) separates files into two-hour blocks and can store its collected values in different files. Each two-hour block consists of a directory containing a chunks subdirectory containing all time series samples for that time window, a metadata file, and an index file (which indexes metric names and labels to time series in the chunks directory). The samples in the chunks directory are grouped into one or more segment files of up to 512 MB each by default. When series are deleted via the API, deletion records are stored in separate deletion files (instead of immediately deleting the data from the block segments).
Separating improves performance and reduces memory consumption, as there won't be such a large file taking up space.
The current block for incoming samples is kept in memory and is not fully persistent. It is protected against crashes by a write-ahead log (WAL) which can be replayed when the Prometheus server is restarted.
Note that a limitation of local storage is that it is not clustered or replicated. Using RAID is suggested for storage availability and snapshots are recommended for backups.
It's also possible to use other databases instead of saving to files. For this, an adapter is needed according to the database where you will store the data. However, there is a loss in performance and efficiency.
Over time, the two-hour blocks are compacted into longer blocks, usually 31 days. This compaction is what causes a loss of precision in the collected data.
That's why Prometheus is not recommended for business metrics.
Retrieval
Responsible for fetching metrics from jobs (applications). Below is an example of how metrics should be formatted.
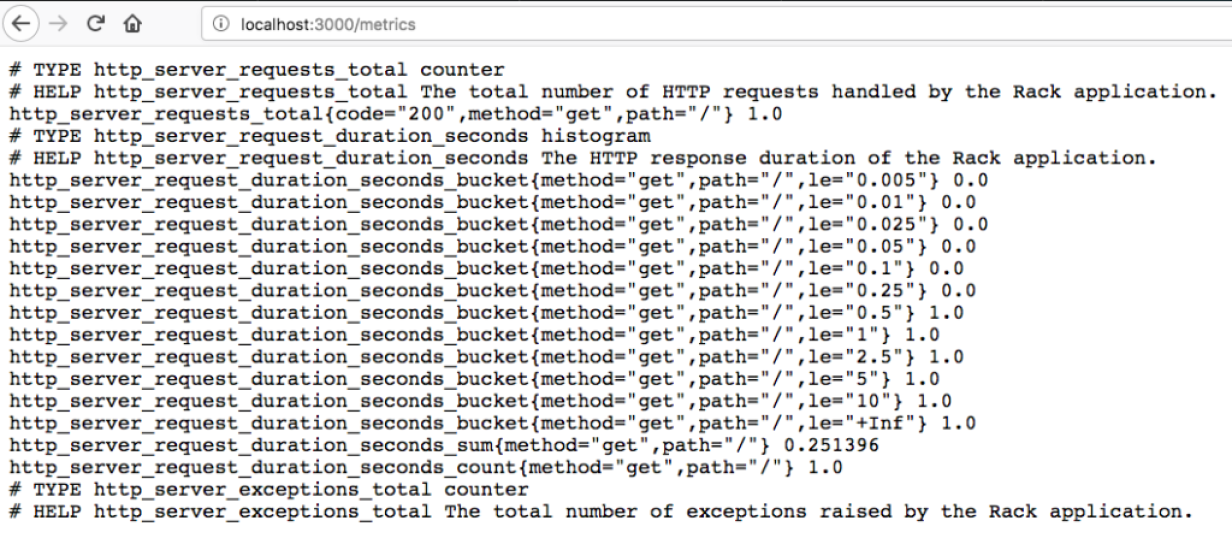
Several libraries in different languages support this. Check the link https://prometheus.io/docs/instrumenting/clientlibs/.
Additionally, there are ready-made libraries like OpenTelemetry that can be used.
Native Integration
Some market tools already have native support for Prometheus by exposing metrics endpoints for Prometheus to collect metrics.
- Grafana
- Docker
- Kubernetes
- Traefik
- Gitlab
- Netdata
- RabbitMQ
- Etcd
- ...
Exporters
When a tool doesn't have Prometheus support (doesn't expose its metrics, or doesn't use the standards needed for Prometheus), we use what we call exporters for this scenario.
Exporters are processes that will collect metrics from these applications and expose them for Prometheus to collect these metrics.
Push Gateway
When a process has a short duration (Short-lived jobs) and there isn't time for Prometheus to fetch the metrics, we use a resource called Push Gateway. In this case, it's up to this process to send its metrics to the push gateway and Prometheus will fetch them from there, functioning as a cache.
Service Discovery
For retrieval to find endpoints of applications that keep changing IP and scaling dynamically, Prometheus provides service discovery functionality and supports various services like Kubernetes, Consul, etc. This is very good for the microservices scenario.
https://prometheus.io/docs/prometheus/latest/configuration/configuration/
HTTP server
This is the part that handles Prometheus interaction with the user.
- WEB UI
- API
- Grafana or some other dashboard
AlertManager
It's not Prometheus's responsibility to deliver alerts to the user when they occur. For this, it uses another system called AlertManager.
Note that AlertManager is a separate app from Prometheus to which Prometheus sends an alert and it's up to it to send it to the user whether through Slack, Telegram, email, or some other push notification.
Can Prometheus be highly available?
Yes, run identical Prometheus servers on two or more separate machines. Identical alerts will be deduplicated by the AlertManager.
For high availability of the AlertManager, you can run multiple instances in a Mesh cluster and configure the Prometheus servers to send notifications to each of them.