First Project
Since the installed server is only available locally during this mini-course, we must scan an app and send the report to localhost:9000 or replacing port 9000 with the forwarding port for the service chosen used in Kubernetes.
The scanner needs a token to send the reports.
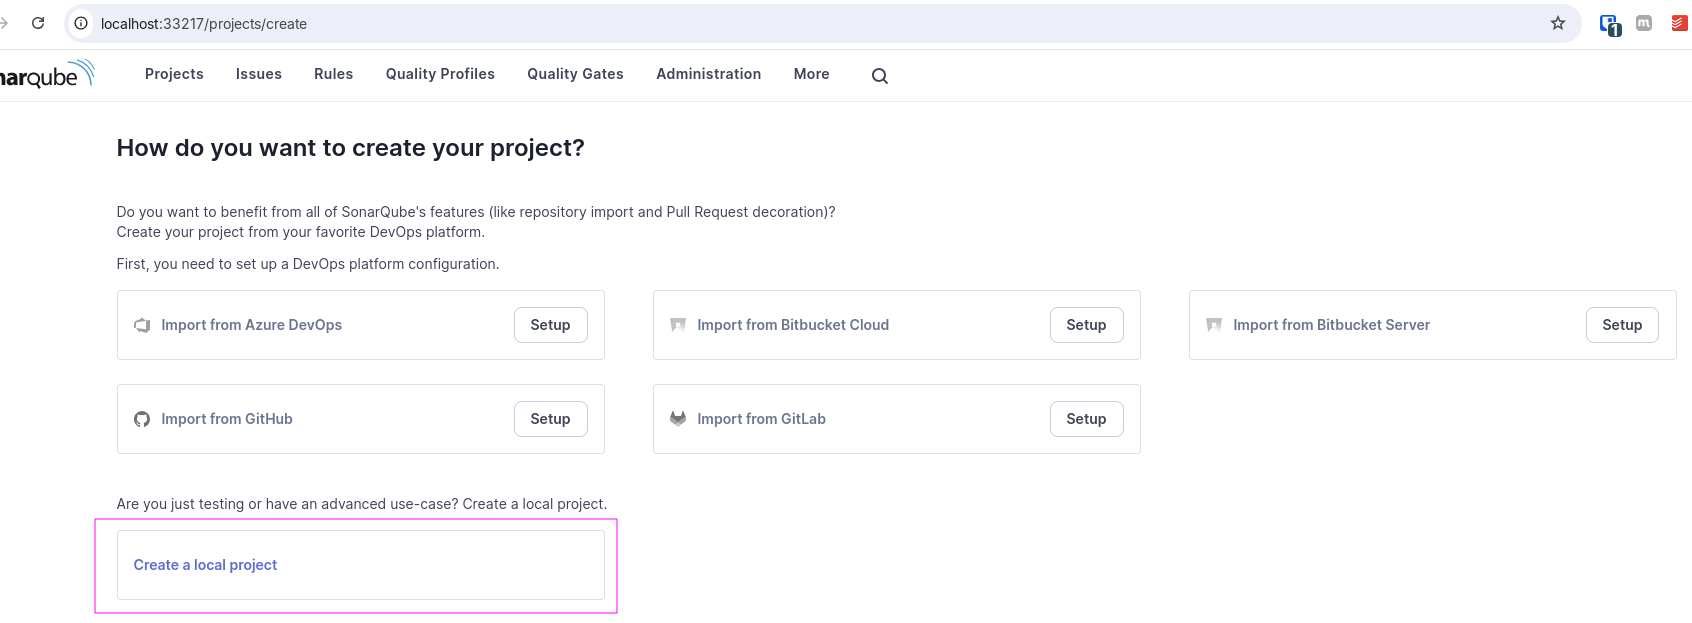
Let's create a manual project just to receive the reports from a project that is on our own machine.
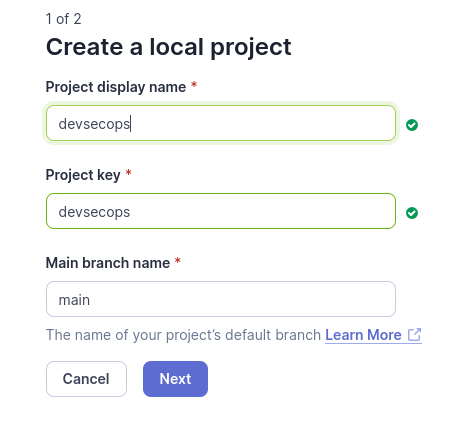
Notice that it will ask for the token validity time. Let's put it here to never expire for now.
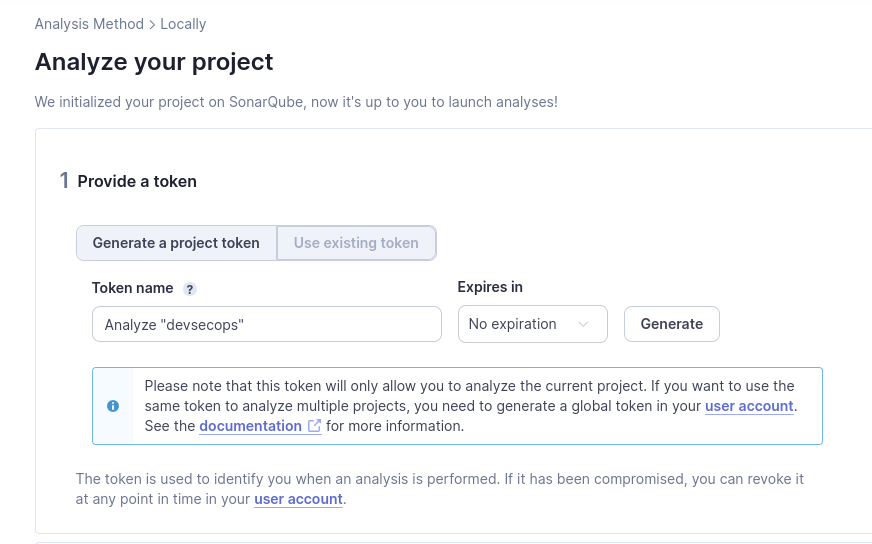
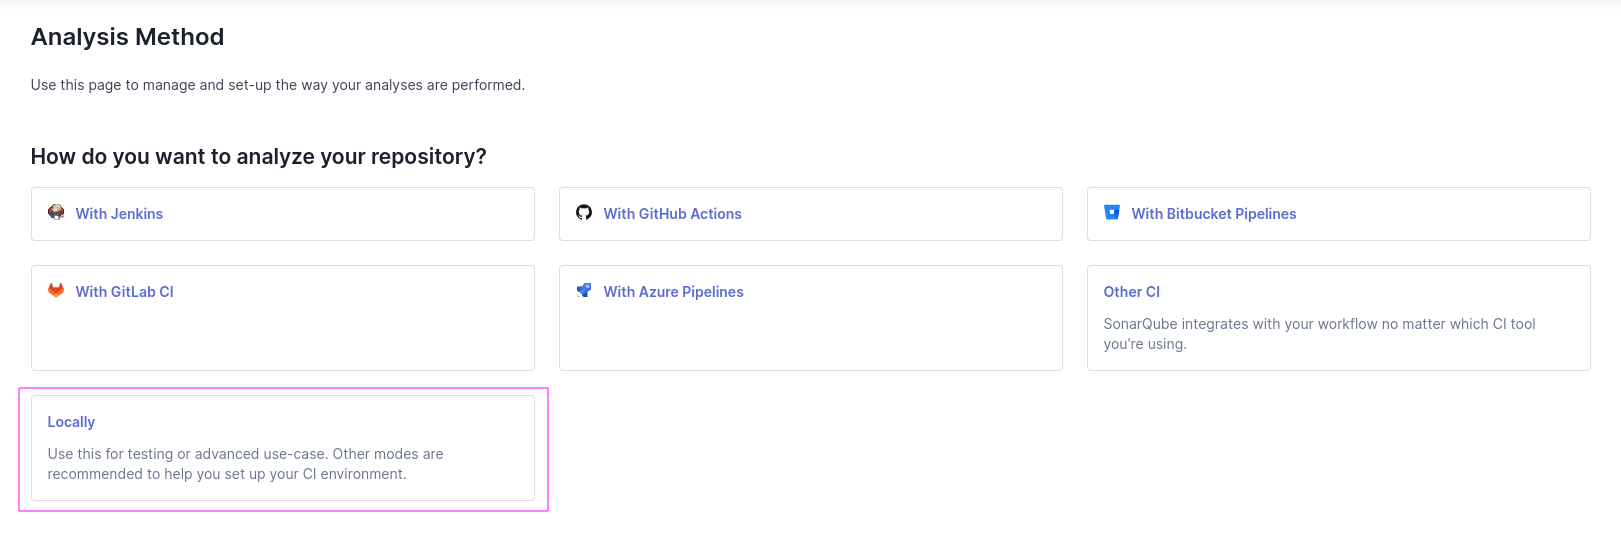
After copying the token it will ask what language is being used in the code to be analyzed. At this moment I'll choose others.
The command given is similar to the command below. Note that we need the sonar-scanner installed to give the command below.
sonar-scanner \
  # project name in sonarqube that will receive the report
  -Dsonar.projectKey=devsecops \
  # the path to the project code from where you are executing
  -Dsonar.sources=. \
  # the server url
  -Dsonar.host.url=http://localhost:33217 \
  # the token
  -Dsonar.token=xxxxxxxxxxxxxxxxxxxxxxxxxx
In a pipeline you would need this scanner available. GitHub Actions already has an action that delivers it ready. When you create the project you will see that it shows how to integrate with various types of pipelines.
We can use a Docker image with the scanner pre-installed and just pass the same parameters.
Since I'm running this locally in the project I want I need to make the root folder of the project available inside the container at /usr/src. Network was set as host because I'm running SonarQube on my own infrastructure so for it to find the localhost:33217 URL it's necessary to put it. The rest are the same environment variables that the container needs and the image name.
docker run --rm -v $(pwd):/usr/src --network=host sonarsource/sonar-scanner-cli \
  sonar-scanner \
  -Dsonar.projectKey=devsecops \
  -Dsonar.sources=. \
  -Dsonar.host.url=http://localhost:33217 \
  -Dsonar.token=sqp_xxxxxxxxxxxxxxxxxxxxxxxxxxxxxxx
We will have an output similar to the output below. I will make comments in this output.
INFO: Scanner configuration file: /opt/sonar-scanner/conf/sonar-scanner.properties
INFO: Project root configuration file: NONE
# Showing the scanner version and installed java
INFO: SonarScanner 5.0.1.3006
INFO: Java 17.0.11 Alpine (64-bit)
INFO: Linux 6.5.0-45-generic amd64
INFO: User cache: /opt/sonar-scanner/.sonar/cache
INFO: Analyzing on SonarQube server 10.6.0.92116
INFO: Default locale: "en_US", source code encoding: "UTF-8" (analysis is platform dependent)
INFO: Load global settings
INFO: Load global settings (done) | time=192ms
INFO: Server id: EA8D9556-AZEzZfCH5j11BErNX0-Z
INFO: Loading required plugins
INFO: Load plugins index
INFO: Load plugins index (done) | time=87ms
INFO: Load/download plugins
INFO: Load/download plugins (done) | time=582ms
INFO: Process project properties
INFO: Process project properties (done) | time=6ms
INFO: Project key: devsecops
# Exactly where we have our code available
INFO: Base dir: /usr/src
INFO: Working dir: /tmp/.scannerwork
INFO: Load project settings for component key: 'devsecops'
INFO: Load project settings for component key: 'devsecops' (done) | time=54ms
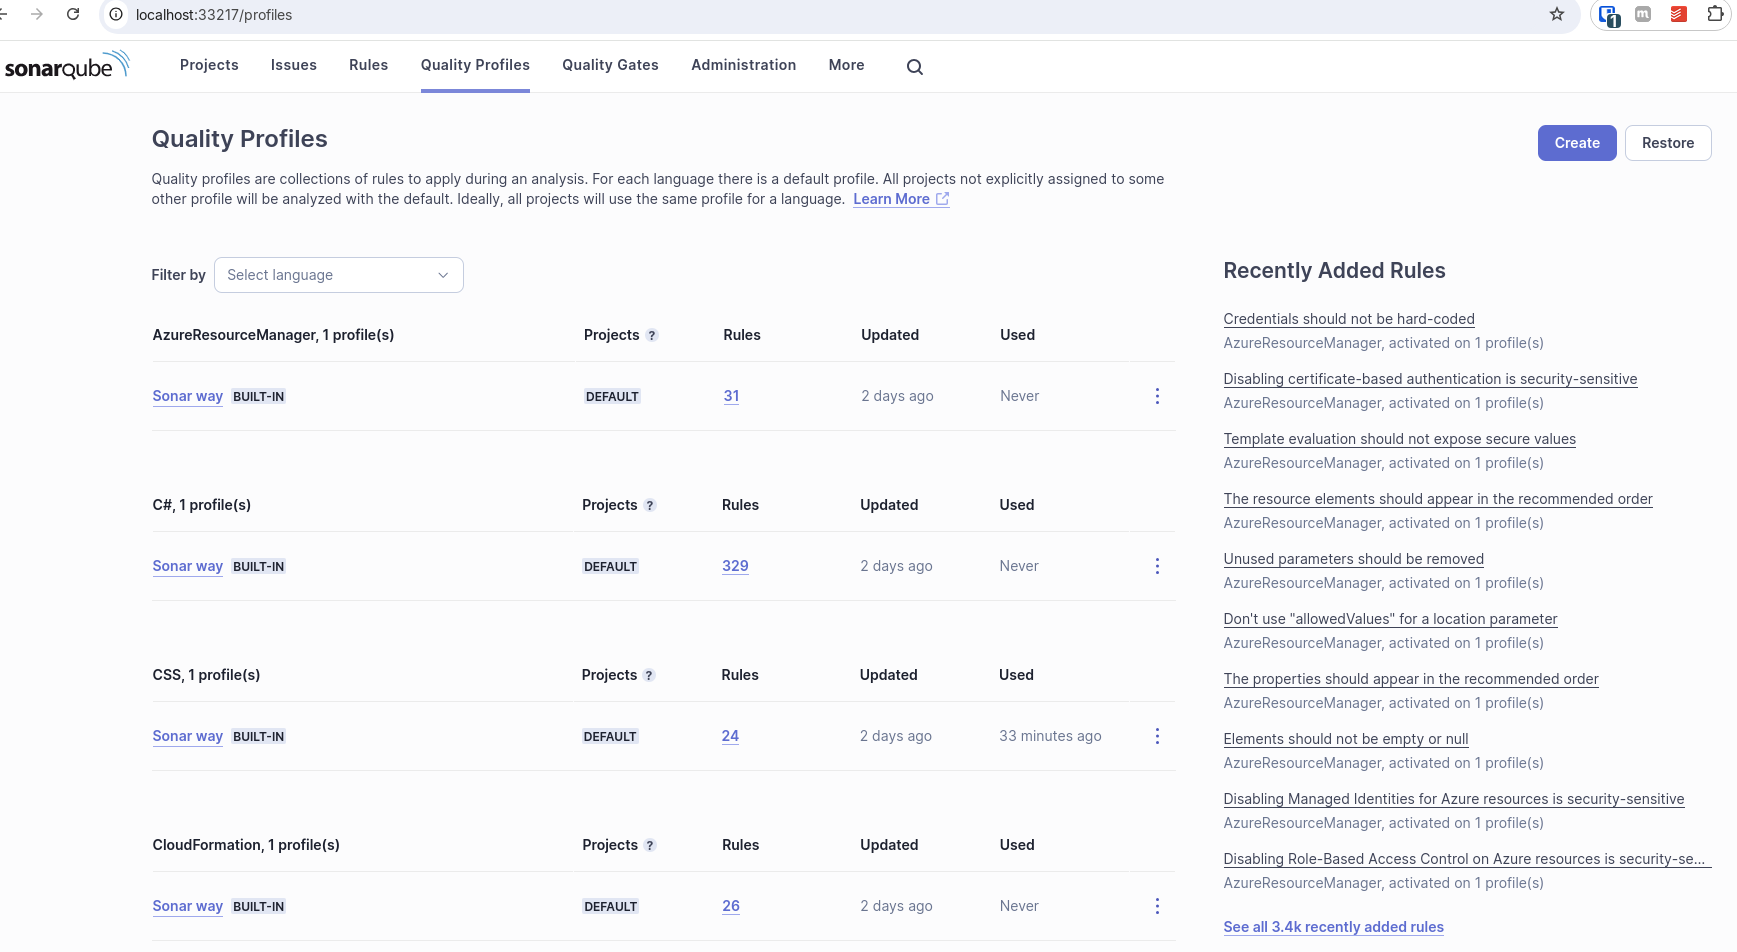
# Since we never created a profile and rules, we are using the default called sonar way
INFO: Load quality profiles
INFO: Load quality profiles (done) | time=86ms
INFO: Load active rules
INFO: Load active rules (done) | time=2289ms
INFO: Load analysis cache
INFO: Load analysis cache (404) | time=7ms
INFO: Preprocessing files...
INFO: 4 languages detected in 990 preprocessed files
INFO: 34674 files ignored because of scm ignore settings
INFO: Loading plugins for detected languages
INFO: Load/download plugins
INFO: Load/download plugins (done) | time=399ms
INFO: Load project repositories
INFO: Load project repositories (done) | time=53ms
INFO: Indexing files...
INFO: Project configuration:
INFO: 990 files indexed
INFO: Quality profile for css: Sonar way
INFO: Quality profile for js: Sonar way
INFO: Quality profile for json: Sonar way
INFO: Quality profile for yaml: Sonar way
INFO: ------------- Run sensors on module devsecops
INFO: Load metrics repository
INFO: Load metrics repository (done) | time=66ms
INFO: Sensor HTML [web]
INFO: Sensor HTML [web] (done) | time=3ms
INFO: Sensor JaCoCo XML Report Importer [jacoco]
INFO: 'sonar.coverage.jacoco.xmlReportPaths' is not defined. Using default locations: target/site/jacoco/jacoco.xml,target/site/jacoco-it/jacoco.xml,build/reports/jacoco/test/jacocoTestReport.xml
INFO: No report imported, no coverage information will be imported by JaCoCo XML Report Importer
INFO: Sensor JaCoCo XML Report Importer [jacoco] (done) | time=1ms
INFO: Sensor IaC CloudFormation Sensor [iac]
INFO: 0 source files to be analyzed
INFO: 0/0 source files have been analyzed
INFO: Sensor IaC CloudFormation Sensor [iac] (done) | time=47ms
INFO: Sensor IaC Kubernetes Sensor [iac]
INFO: 2 source files to be analyzed
INFO: 2/2 source files have been analyzed
INFO: Sensor IaC Kubernetes Sensor [iac] (done) | time=107ms
INFO: Sensor IaC AzureResourceManager Sensor [iac]
INFO: 0 source files to be analyzed
INFO: 0/0 source files have been analyzed
INFO: Sensor IaC AzureResourceManager Sensor [iac] (done) | time=37ms
INFO: Sensor Java Config Sensor [iac]
INFO: 0 source files to be analyzed
INFO: 0/0 source files have been analyzed
INFO: Sensor Java Config Sensor [iac] (done) | time=6ms
INFO: Sensor JavaScript/TypeScript analysis [javascript]
INFO: Detected os: Linux arch: amd64 alpine: true. Platform: UNSUPPORTED
INFO: Using Node.js executable: 'node'.
INFO: Memory configuration: OS (31820 MB), Node.js (4144 MB).
INFO: Found 0 tsconfig.json file(s): []
INFO: Creating TypeScript program
INFO: TypeScript configuration file /tmp/tmp-91-yel3JrC1hBfH
INFO: 19 source files to be analyzed
INFO: Starting analysis with current program
INFO: Analyzed 19 file(s) with current program
INFO: 19/19 source files have been analyzed
INFO: Hit the cache for 0 out of 19
INFO: Miss the cache for 19 out of 19: ANALYSIS_MODE_INELIGIBLE [19/19]
INFO: Sensor JavaScript/TypeScript analysis [javascript] (done) | time=6018ms
INFO: Sensor JavaScript inside YAML analysis [javascript]
INFO: No input files found for analysis
INFO: Hit the cache for 0 out of 0
INFO: Miss the cache for 0 out of 0
INFO: Sensor JavaScript inside YAML analysis [javascript] (done) | time=18ms
INFO: Sensor CSS Rules [javascript]
INFO: 3 source files to be analyzed
INFO: 3/3 source files have been analyzed
INFO: Hit the cache for 0 out of 0
INFO: Miss the cache for 0 out of 0
INFO: Sensor CSS Rules [javascript] (done) | time=153ms
INFO: Sensor CSS Metrics [javascript]
INFO: Sensor CSS Metrics [javascript] (done) | time=8ms
INFO: Sensor IaC Docker Sensor [iac]
INFO: 0 source files to be analyzed
INFO: 0/0 source files have been analyzed
INFO: Sensor IaC Docker Sensor [iac] (done) | time=14ms
INFO: Sensor TextAndSecretsSensor [text]
INFO: Available processors: 24
INFO: Using 24 threads for analysis.
INFO: The property "sonar.tests" is not set. To improve the analysis accuracy, we categorize a file as a test file if any of the following is true:
* The filename starts with "test"
* The filename contains "test." or "tests."
* Any directory in the file path is named: "doc", "docs", "test" or "tests"
* Any directory in the file path has a name ending in "test" or "tests"
INFO: Using git CLI to retrieve untracked files
INFO: Analyzing language associated files and files included via "sonar.text.inclusions" that are tracked by git
INFO: 90 source files to be analyzed
INFO: 90/90 source files have been analyzed
INFO: Sensor TextAndSecretsSensor [text] (done) | time=1792ms
INFO: ------------- Run sensors on project
INFO: Sensor Zero Coverage Sensor
INFO: Sensor Zero Coverage Sensor (done) | time=7ms
INFO: SCM Publisher SCM provider for this project is: git
INFO: SCM Publisher 24 source files to be analyzed
INFO: SCM Publisher 24/24 source files have been analyzed (done) | time=164ms
INFO: CPD Executor 15 files had no CPD blocks
INFO: CPD Executor Calculating CPD for 4 files
INFO: CPD Executor CPD calculation finished (done) | time=8ms
INFO: SCM revision ID '8a2fe2a3013c79421f72e48a74d4bb65237a266d'
INFO: Analysis report generated in 35ms, dir size=267.9 kB
INFO: Analysis report compressed in 37ms, zip size=77.1 kB
INFO: Analysis report uploaded in 63ms
INFO: ANALYSIS SUCCESSFUL, you can find the results at: http://localhost:33217/dashboard?id=devsecops
INFO: Note that you will be able to access the updated dashboard once the server has processed the submitted analysis report
INFO: More about the report processing at http://localhost:33217/api/ce/task?id=cc4d87c0-4d45-4647-acd2-0c52501dd8f4
INFO: Analysis total time: 13.137 s
INFO: ------------------------------------------------------------------------
INFO: EXECUTION SUCCESS
INFO: ------------------------------------------------------------------------
INFO: Total time: 14.939s
INFO: Final Memory: 18M/96M
INFO: ------------------------------------------------------------------------
Just to illustrate the Sonar Way Quality Profile which is the default of SonarQube