Control Access to GUI Elements
- Solo debemos exponer servicios externamente si realmente lo necesitamos
- Si necesitamos acceder a algún servicio que no compete a todos, podemos simplemente usar
kubectl port-forwardokubectl proxyen lugar de exponer mediante un balanceador de carga.
El Kubernetes Dashboard tiene muchos privilegios en el clúster y Tesla fue hackeada en 2018 por este motivo.
- No usa RBAC o roles
- El Kubernetes de Tesla estaba expuesto a Internet, lo que no es estándar.
Kubectl Proxy y Kubectl Port-Forward
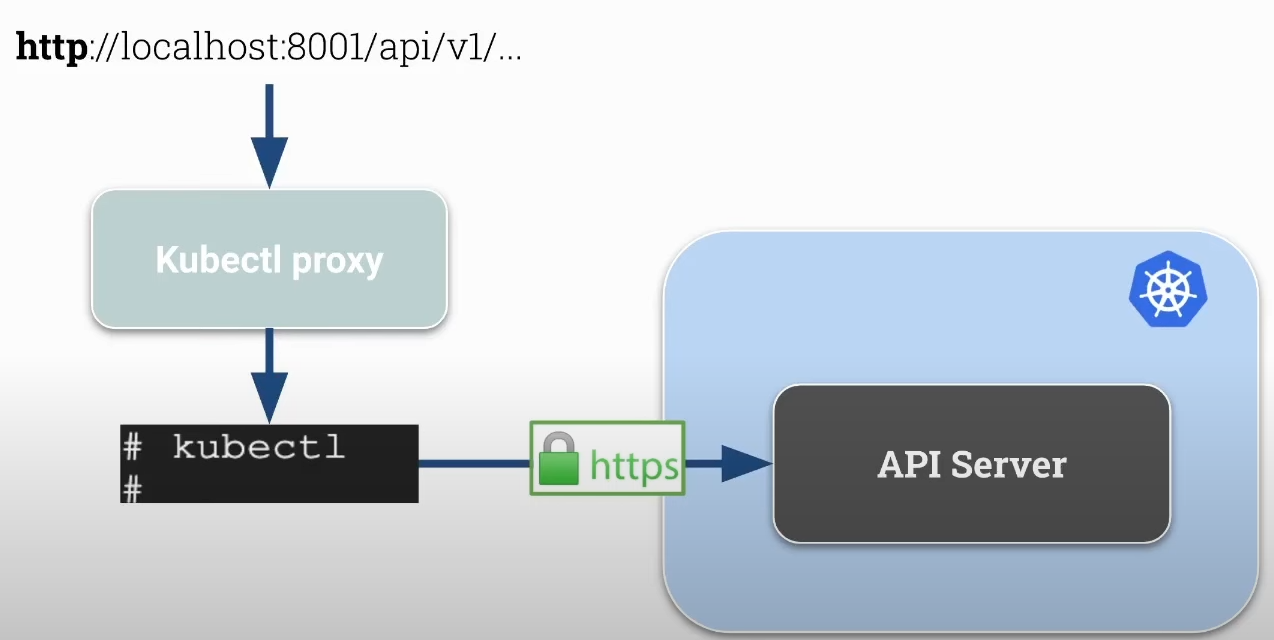
Proxy
- Crea un servidor proxy entre el localhost y el Kubernetes API server.
- Usa la conexión configurada en tu kubeconfig y las credenciales para comunicarse con el api server
- Permite acceder a la API de Kubernetes localmente con HTTP y sin autenticación para que sea cómodo desarrollar y depurar.
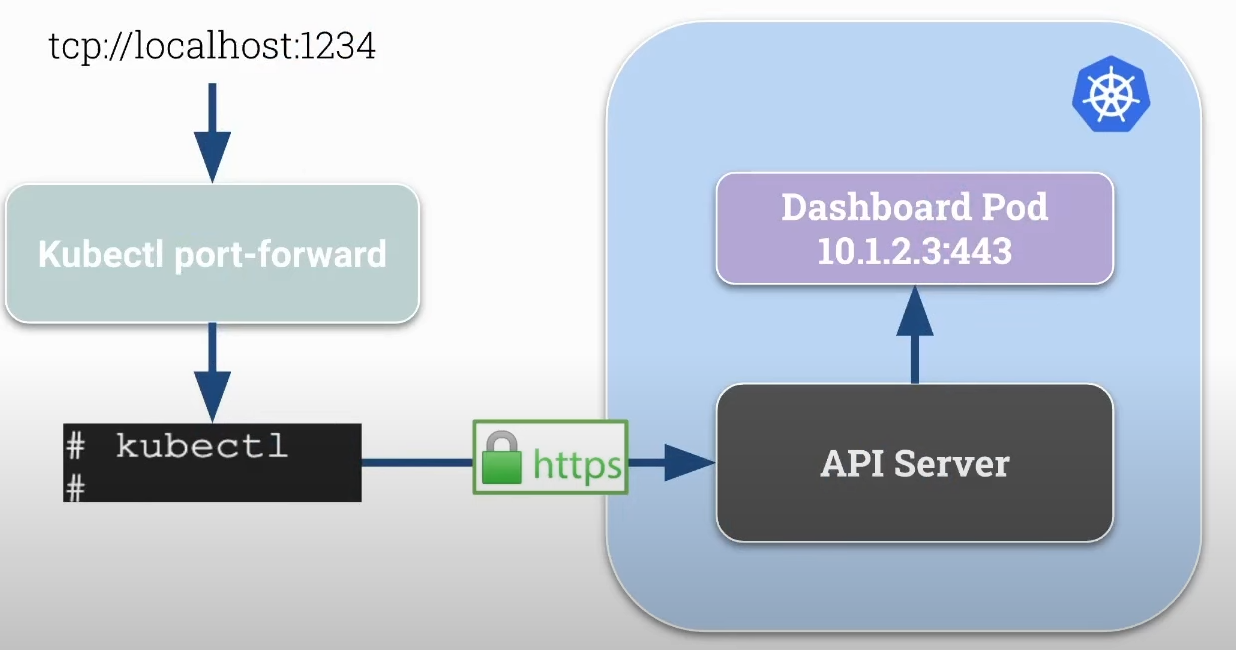
Port Forward
- Reenvía las conexiones del localhost en un puerto específico al puerto de un pod dentro del clúster.
- Más genérico que kubectl proxy.
- Puede usarse para protocolos TCP y no solo para HTTP como en el caso de kubectl proxy.
La IP del pod es la IP interna del clúster. Tenemos por ejemplo el pod del Dashboard ejecutándose en el clúster sin estar expuesto externamente.
- Si tenemos el api-server ejecutándose dentro de un pod, podemos utilizar también el port forward.
Kubernetes Dashboard
Si queremos exponer el dashboard a Internet sin usar kubectl debemos tener ciertos cuidados como el uso de un Ingress (Nginx) y aplicar la seguridad debida como autenticación utilizando un LDAP o algún otro sistema.
Vamos a instalar el kubernetes dashboard.
root@cks-master:~# curl -fsSL -o get_helm.sh https://raw.githubusercontent.com/helm/helm/main/scripts/get-helm-3

root@cks-master:~# chmod 700 get_helm.sh

root@cks-master:~# ./get_helm.sh
Downloading https://get.helm.sh/helm-v3.15.4-linux-amd64.tar.gz
Verifying checksum... Done.
Preparing to install helm into /usr/local/bin
helm installed into /usr/local/bin/helm

root@cks-master:~# helm version
version.BuildInfo{Version:"v3.15.4", GitCommit:"fa9efb07d9d8debbb4306d72af76a383895aa8c4", GitTreeState:"clean", GoVersion:"go1.22.6"}

root@cks-master:~# helm repo add kubernetes-dashboard https://kubernetes.github.io/dashboard/
"kubernetes-dashboard" has been added to your repositories
root@cks-master:~#
root@cks-master:~# helm upgrade --install kubernetes-dashboard kubernetes-dashboard/kubernetes-dashboard --create-namespace --namespace kubernetes-dashboard
Release "kubernetes-dashboard" does not exist. Installing it now.
Se creó todo en el namespace kubernetes-dashboard, vamos a comprobarlo.
root@cks-master:~# kubectl get -n kubernetes-dashboard svc,pod
NAME                                           TYPE        CLUSTER-IP       EXTERNAL-IP   PORT(S)                         AGE
service/kubernetes-dashboard-api               ClusterIP   10.98.57.37      <none>        8000/TCP                        2m36s
service/kubernetes-dashboard-auth              ClusterIP   10.109.32.254    <none>        8000/TCP                        2m36s
service/kubernetes-dashboard-kong-manager      NodePort    10.108.177.217   <none>        8002:32335/TCP,8445:32590/TCP   2m36s
service/kubernetes-dashboard-kong-proxy        ClusterIP   10.105.243.208   <none>        443/TCP                         2m36s
service/kubernetes-dashboard-metrics-scraper   ClusterIP   10.96.106.246    <none>        8000/TCP                        2m36s
service/kubernetes-dashboard-web               ClusterIP   10.100.17.113    <none>        8000/TCP                        2m36s

NAME                                                        READY   STATUS    RESTARTS   AGE
pod/kubernetes-dashboard-api-9567bc759-mdvl5                1/1     Running   0          2m36s
pod/kubernetes-dashboard-auth-784d848dcb-p686b              1/1     Running   0          2m36s
pod/kubernetes-dashboard-kong-7696bb8c88-v4zk6              1/1     Running   0          2m36s
pod/kubernetes-dashboard-metrics-scraper-5485b64c47-9fkpb   1/1     Running   0          2m36s
pod/kubernetes-dashboard-web-84f8d6fff4-t4qgq               1/1     Running   0          2m36s
Necesitamos prestar atención.
- Solo expón a Internet si es necesario y si está protegido.
- Restringe el acceso usando RBAC.
- Refuerza la seguridad.
- Cambia los argumentos en el deployment. Consulta en dashboard arguments.
Si fuéramos a aplicar esto de la manera en que está... No tenemos un ingress, no tenemos certificados válidos, no tenemos nada como autenticación aún. Tal como está no es seguro.
Vamos a hacer un análisis del values.yaml que tenemos en este helm
root@cks-master:~# helm show values kubernetes-dashboard/kubernetes-dashboard

# General configuration shared across resources
app:
  # Mode determines if chart should deploy a full Dashboard with all containers or just the API.
  # - dashboard - deploys all the containers
  # - api - deploys just the API
  mode: 'dashboard'
  image:
    pullPolicy: IfNotPresent
    pullSecrets: []
  scheduling:
    # Node labels for pod assignment
    # Ref: https://kubernetes.io/docs/user-guide/node-selection/
    nodeSelector: {}
  security:
    # Allow overriding csrfKey used by API/Auth containers.
    # It has to be base64 encoded random 256 bytes string.
    # If empty, it will be autogenerated.
    csrfKey: ~
    # SecurityContext to be added to pods
    # To disable set the following configuration to null:
    # securityContext: null
    securityContext:
      runAsNonRoot: true
      seccompProfile:
        type: RuntimeDefault
    # ContainerSecurityContext to be added to containers
    # To disable set the following configuration to null:
    # containerSecurityContext: null
    containerSecurityContext:
      allowPrivilegeEscalation: false
      readOnlyRootFilesystem: true
      runAsUser: 1001
      runAsGroup: 2001
      capabilities:
        drop: ["ALL"]
    # Pod Disruption Budget configuration
    # Ref: https://kubernetes.io/docs/tasks/run-application/configure-pdb/
    podDisruptionBudget:
      enabled: false
      minAvailable: 0
      maxUnavailable: 0
    networkPolicy:
      enabled: false
      ingressDenyAll: false
      # Raw network policy spec that overrides predefined spec
      # Example:
      # spec:
      #   egress:
      #     - ports:
      #         - port: 123
      spec: {}

  # Common labels & annotations shared across all deployed resources
  labels: {}
  annotations: {}
  # Common priority class used for all deployed resources
  priorityClassName: null
  settings:
    ## Global dashboard settings
    global:
    #  # Cluster name that appears in the browser window title if it is set
    #  clusterName: ""
    #  # Max number of items that can be displayed on each list page
    #  itemsPerPage: 10
    #  # Number of seconds between every auto-refresh of logs
    #  logsAutoRefreshTimeInterval: 5
    #  # Number of seconds between every auto-refresh of every resource. Set 0 to disable
    #  resourceAutoRefreshTimeInterval: 5
    #  # Hide all access denied warnings in the notification panel
    #  disableAccessDeniedNotifications: false
    ## Pinned resources that will be displayed in dashboard's menu
    pinnedResources: []
    # - kind: customresourcedefinition
    #  #  Fully qualified name of a CRD
    #  name: prometheus.monitoring.coreos.com
    #  #  Display name
    #  displayName: Prometheus
    #  #  Is this CRD namespaced?
    #  namespaced: true
  ingress:
    enabled: false
    hosts:
      # Keep 'localhost' host only if you want to access Dashboard using 'kubectl port-forward ...' on:
      # https://localhost:8443
      - localhost
    # - kubernetes.dashboard.domain.com
    ingressClassName: internal-nginx
    # Use only if your ingress controllers support default ingress classes.
    # If set to true ingressClassName will be ignored and not added to the Ingress resources.
    # It should fall back to using IngressClass marked as the default.
    useDefaultIngressClass: false
    # This will append our Ingress with annotations required by our default configuration.
    #    nginx.ingress.kubernetes.io/backend-protocol: "HTTPS"
    #    nginx.ingress.kubernetes.io/ssl-passthrough: "true"
    #    nginx.ingress.kubernetes.io/ssl-redirect: "true"
    useDefaultAnnotations: true
    pathType: ImplementationSpecific
    # If path is not the default (/), rewrite-target annotation will be added to the Ingress.
    # It allows serving Kubernetes Dashboard on a sub-path. Make sure that the configured path
    # does not conflict with gateway route configuration.
    path: /
    issuer:
      name: selfsigned
      # Scope determines what kind of issuer annotation will be used on ingress resource
      # - default - adds 'cert-manager.io/issuer'
      # - cluster - adds 'cert-manager.io/cluster-issuer'
      # - disabled - disables cert-manager annotations
      scope: default
    tls:
      enabled: true
      # If provided it will override autogenerated secret name
      secretName: ""
    labels: {}
    annotations: {}
  # Use the following toleration if Dashboard can be deployed on a tainted control-plane nodes
  # - key: node-role.kubernetes.io/control-plane
  #   effect: NoSchedule
  tolerations: []
  affinity: {}

auth:
  role: auth
  image:
    repository: docker.io/kubernetesui/dashboard-auth
    tag: 1.1.3
  scaling:
    replicas: 1
    revisionHistoryLimit: 10
  containers:
    ports:
      - name: auth
        containerPort: 8000
        protocol: TCP
    args: []
    env: []
    volumeMounts:
      - mountPath: /tmp
        name: tmp-volume
    # TODO: Validate configuration
    resources:
      requests:
        cpu: 100m
        memory: 200Mi
      limits:
        cpu: 250m
        memory: 400Mi
  automountServiceAccountToken: true
  volumes:
    # Create on-disk volume to store exec logs (required)
    - name: tmp-volume
      emptyDir: {}
  nodeSelector: {}
  # Labels & annotations shared between API related resources
  labels: {}
  annotations: {}

# API deployment configuration
api:
  role: api
  image:
    repository: docker.io/kubernetesui/dashboard-api
    tag: 1.7.0
  scaling:
    replicas: 1
    revisionHistoryLimit: 10
  containers:
    ports:
      - name: api
        containerPort: 8000
        protocol: TCP
    # Additional container arguments
    # Full list of arguments: https://github.com/kubernetes/dashboard/blob/master/docs/common/arguments.md
    # args:
    # - --system-banner="Welcome to the Kubernetes Dashboard"
    args: []
    # Additional container environment variables
    # env:
    # - name: SOME_VAR
    #   value: 'some value'
    env: []
    # Additional volume mounts
    # - mountPath: /kubeconfig
    #   name: dashboard-kubeconfig
    #   readOnly: true
    volumeMounts:
      # Create volume mount to store exec logs (required)
      - mountPath: /tmp
        name: tmp-volume
    # TODO: Validate configuration
    resources:
      requests:
        cpu: 100m
        memory: 200Mi
      limits:
        cpu: 250m
        memory: 400Mi
  automountServiceAccountToken: true
  # Additional volumes
  # - name: dashboard-kubeconfig
  #   secret:
  #     defaultMode: 420
  #     secretName: dashboard-kubeconfig
  volumes:
    # Create on-disk volume to store exec logs (required)
    - name: tmp-volume
      emptyDir: {}
  nodeSelector: {}
  # Labels & annotations shared between API related resources
  labels: {}
  annotations: {}

# WEB UI deployment configuration
web:
  role: web
  image:
    repository: docker.io/kubernetesui/dashboard-web
    tag: 1.4.0
  scaling:
    replicas: 1
    revisionHistoryLimit: 10
  containers:
    ports:
      - name: web
        containerPort: 8000
        protocol: TCP
    # Additional container arguments
    # Full list of arguments: https://github.com/kubernetes/dashboard/blob/master/docs/common/arguments.md
    # args:
    # - --system-banner="Welcome to the Kubernetes Dashboard"
    args: []
    # Additional container environment variables
    # env:
    # - name: SOME_VAR
    #   value: 'some value'
    env: []
    # Additional volume mounts
    # - mountPath: /kubeconfig
    #   name: dashboard-kubeconfig
    #   readOnly: true
    volumeMounts:
      # Create volume mount to store logs (required)
      - mountPath: /tmp
        name: tmp-volume
    # TODO: Validate configuration
    resources:
      requests:
        cpu: 100m
        memory: 200Mi
      limits:
        cpu: 250m
        memory: 400Mi
  automountServiceAccountToken: true
  # Additional volumes
  # - name: dashboard-kubeconfig
  #   secret:
  #     defaultMode: 420
  #     secretName: dashboard-kubeconfig
  volumes:
    # Create on-disk volume to store exec logs (required)
    - name: tmp-volume
      emptyDir: {}
  nodeSelector: {}
  # Labels & annotations shared between WEB UI related resources
  labels: {}
  annotations: {}

### Metrics Scraper
### Container to scrape, store, and retrieve a window of time from the Metrics Server.
### refs: https://github.com/kubernetes/dashboard/tree/master/modules/metrics-scraper
metricsScraper:
  enabled: true
  role: metrics-scraper
  image:
    repository: docker.io/kubernetesui/dashboard-metrics-scraper
    tag: 1.1.1
  scaling:
    replicas: 1
    revisionHistoryLimit: 10
  containers:
    ports:
      - containerPort: 8000
        protocol: TCP
    args: []
    # Additional container environment variables
    # env:
    # - name: SOME_VAR
    #   value: 'some value'
    env: []
    # Additional volume mounts
    # - mountPath: /kubeconfig
    #   name: dashboard-kubeconfig
    #   readOnly: true
    volumeMounts:
      # Create volume mount to store logs (required)
      - mountPath: /tmp
        name: tmp-volume
    # TODO: Validate configuration
    resources:
      requests:
        cpu: 100m
        memory: 200Mi
      limits:
        cpu: 250m
        memory: 400Mi
    livenessProbe:
      httpGet:
        scheme: HTTP
        path: /
        port: 8000
      initialDelaySeconds: 30
      timeoutSeconds: 30
  automountServiceAccountToken: true
  # Additional volumes
  # - name: dashboard-kubeconfig
  #   secret:
  #     defaultMode: 420
  #     secretName: dashboard-kubeconfig
  volumes:
    - name: tmp-volume
      emptyDir: {}
  nodeSelector: {}
  # Labels & annotations shared between WEB UI related resources
  labels: {}
  annotations: {}

## Optional Metrics Server sub-chart configuration
## Enable this if you don't already have metrics-server enabled on your cluster and
## want to use it with dashboard metrics-scraper
## refs:
##  - https://github.com/kubernetes-sigs/metrics-server
##  - https://github.com/kubernetes-sigs/metrics-server/tree/master/charts/metrics-server
metrics-server:
  enabled: false
  args:
    - --kubelet-preferred-address-types=InternalIP
    - --kubelet-insecure-tls

## Required Kong sub-chart with DBless configuration to act as a gateway
## for our all containers.
kong:
  enabled: true
  ## Configuration reference: https://docs.konghq.com/gateway/3.6.x/reference/configuration
  env:
    dns_order: LAST,A,CNAME,AAAA,SRV
    plugins: 'off'
    nginx_worker_processes: 1
  ingressController:
    enabled: false
  dblessConfig:
    configMap: kong-dbless-config
  proxy:
    type: ClusterIP
    http:
      enabled: false

## Optional Cert Manager sub-chart configuration
## Enable this if you don't already have cert-manager enabled on your cluster.
cert-manager:
  enabled: false
  installCRDs: true

## Optional Nginx Ingress sub-chart configuration
## Enable this if you don't already have nginx-ingress enabled on your cluster.
nginx:
  enabled: false
  controller:
    electionID: ingress-controller-leader
    ingressClassResource:
      name: internal-nginx
      default: false
      controllerValue: k8s.io/internal-ingress-nginx
    service:
      type: ClusterIP

## Extra configurations:
## - manifests
## - predefined roles
## - prometheus
## - etc...
extras:
  # Extra Kubernetes manifests to be deployed
  # manifests:
  # - apiVersion: v1
  #   kind: ConfigMap
  #   metadata:
  #     name: additional-configmap
  #   data:
  #     mykey: myvalue
  manifests: []
  serviceMonitor:
    # Whether to create a Prometheus Operator service monitor.
    enabled: false
    # Here labels can be added to the serviceMonitor
    labels: {}
    # Here annotations can be added to the serviceMonitor
    annotations: {}
    # metrics.serviceMonitor.metricRelabelings Specify Metric Relabelings to add to the scrape endpoint
    # ref: https://github.com/coreos/prometheus-operator/blob/master/Documentation/api.md#relabelconfig
    metricRelabelings: []
    # metrics.serviceMonitor.relabelings [array] Prometheus relabeling rules
    relabelings: []
    # ServiceMonitor connection scheme. Defaults to HTTPS.
    scheme: https
    # ServiceMonitor connection tlsConfig. Defaults to {insecureSkipVerify:true}.
    tlsConfig:
      insecureSkipVerify: true