Dashboard
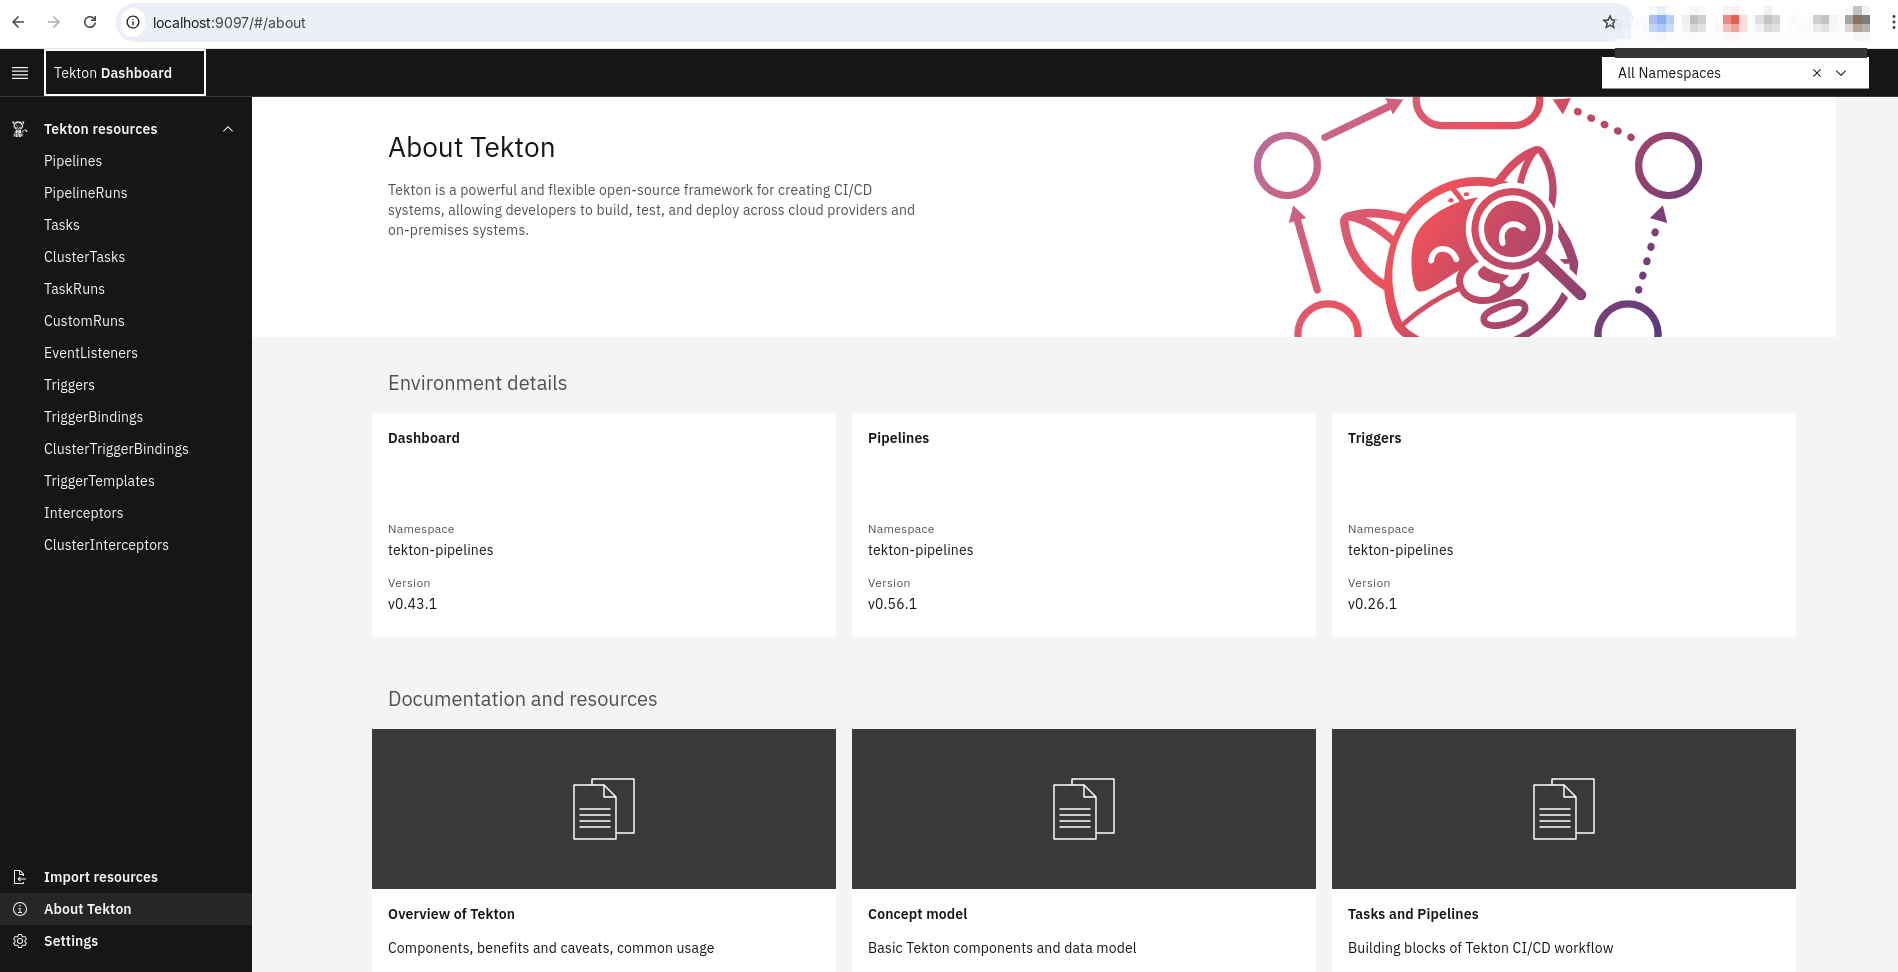
Vamos a comprobar un poco el dashboard. Vamos a encontrar el servicio y exponer el puerto
k get svc -n tekton-pipelines
NAME                                TYPE        CLUSTER-IP       EXTERNAL-IP   PORT(S)                              AGE
tekton-chains-metrics               ClusterIP   10.97.25.22      <none>        9090/TCP                             10h
tekton-dashboard                    ClusterIP   10.100.96.146    <none>        9097/TCP                             10h
tekton-events-controller            ClusterIP   10.105.115.210   <none>        9090/TCP,8008/TCP,8080/TCP           10h
tekton-operator-proxy-webhook       ClusterIP   10.102.16.99     <none>        443/TCP                              10h
tekton-pipelines-controller         ClusterIP   10.96.179.193    <none>        9090/TCP,8008/TCP,8080/TCP           10h
tekton-pipelines-remote-resolvers   ClusterIP   10.104.95.223    <none>        9090/TCP,8008/TCP,8080/TCP           10h
tekton-pipelines-webhook            ClusterIP   10.106.146.247   <none>        9090/TCP,8008/TCP,443/TCP,8080/TCP   10h
tekton-triggers-controller          ClusterIP   10.110.79.44     <none>        9000/TCP                             10h
tekton-triggers-core-interceptors   ClusterIP   10.96.76.242     <none>        8443/TCP                             10h
tekton-triggers-webhook             ClusterIP   10.109.205.230   <none>        443/TCP                              10h

# Observamos arriba que el dashboard atiende en el puerto 9097 así que vamos a hacer un port-forward local para tener acceso en localhost:9097
k -n tekton-pipelines port-forward svc/tekton-dashboard 9097:9097
Forwarding from 127.0.0.1:9097 -> 9097
Forwarding from [::1]:9097 -> 9097
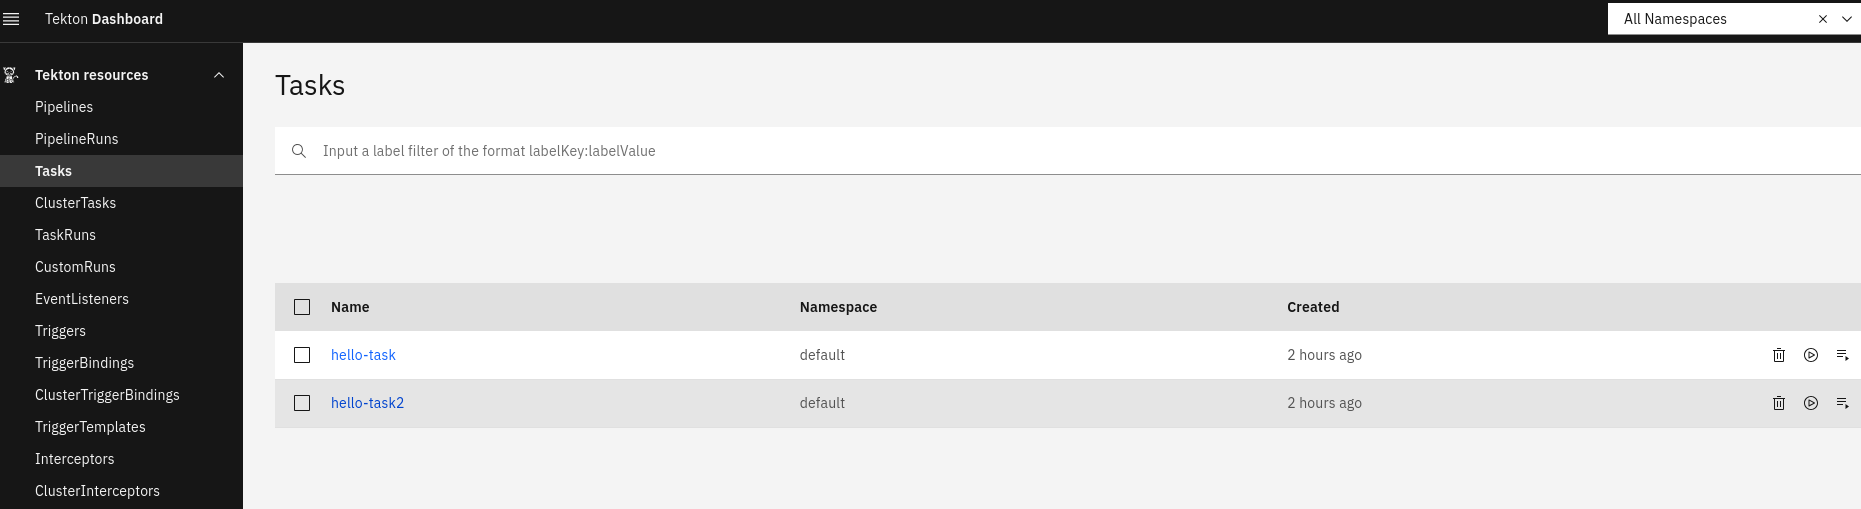
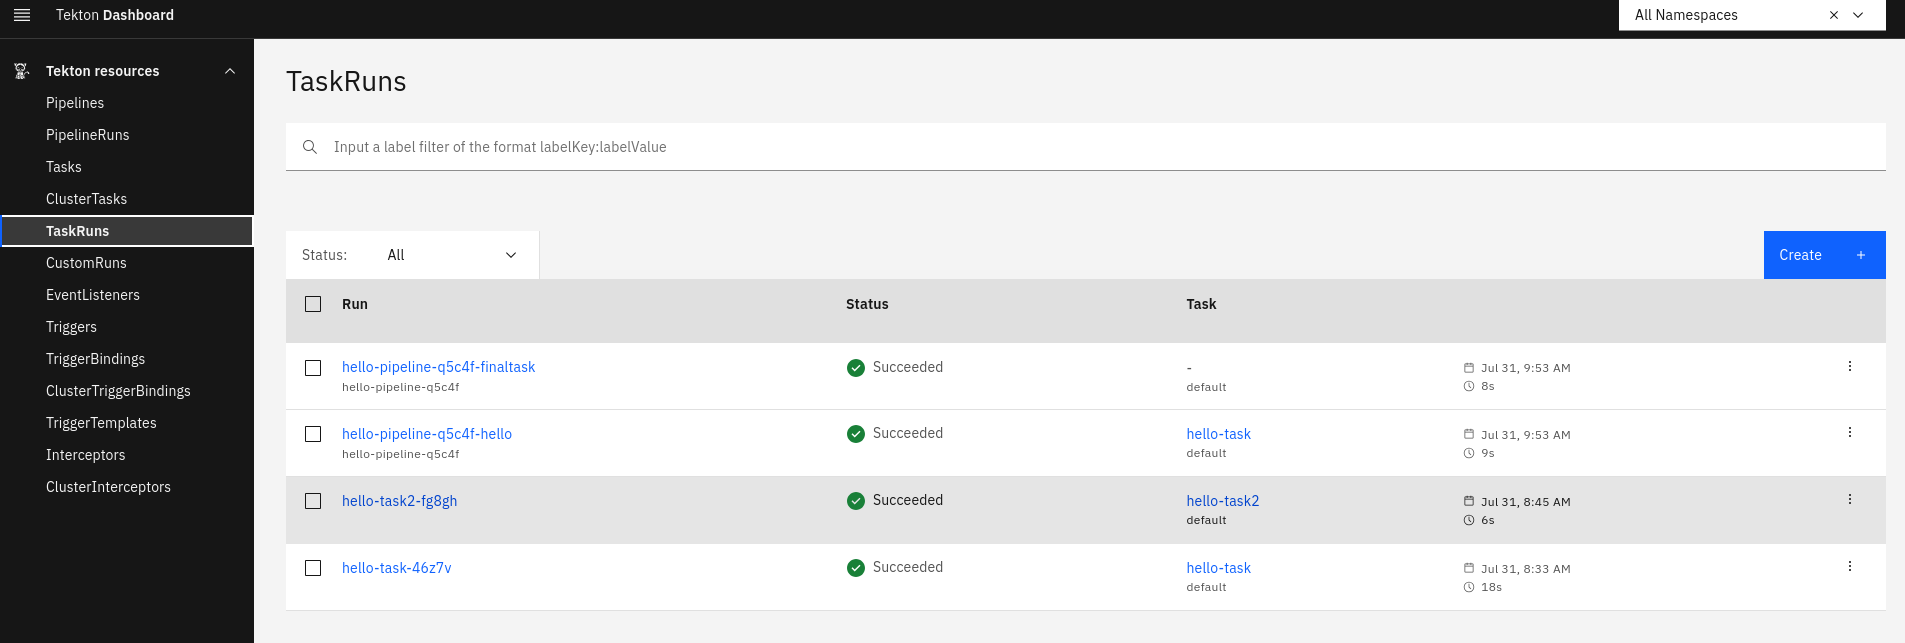
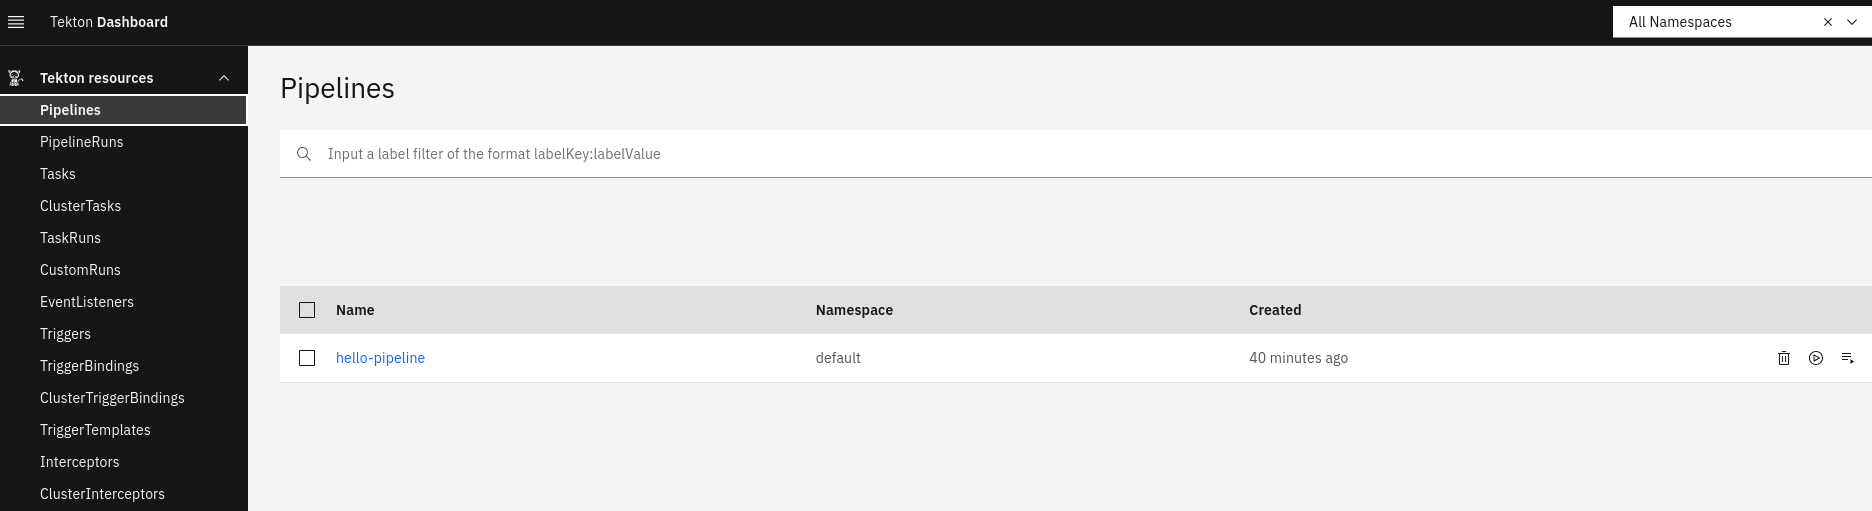
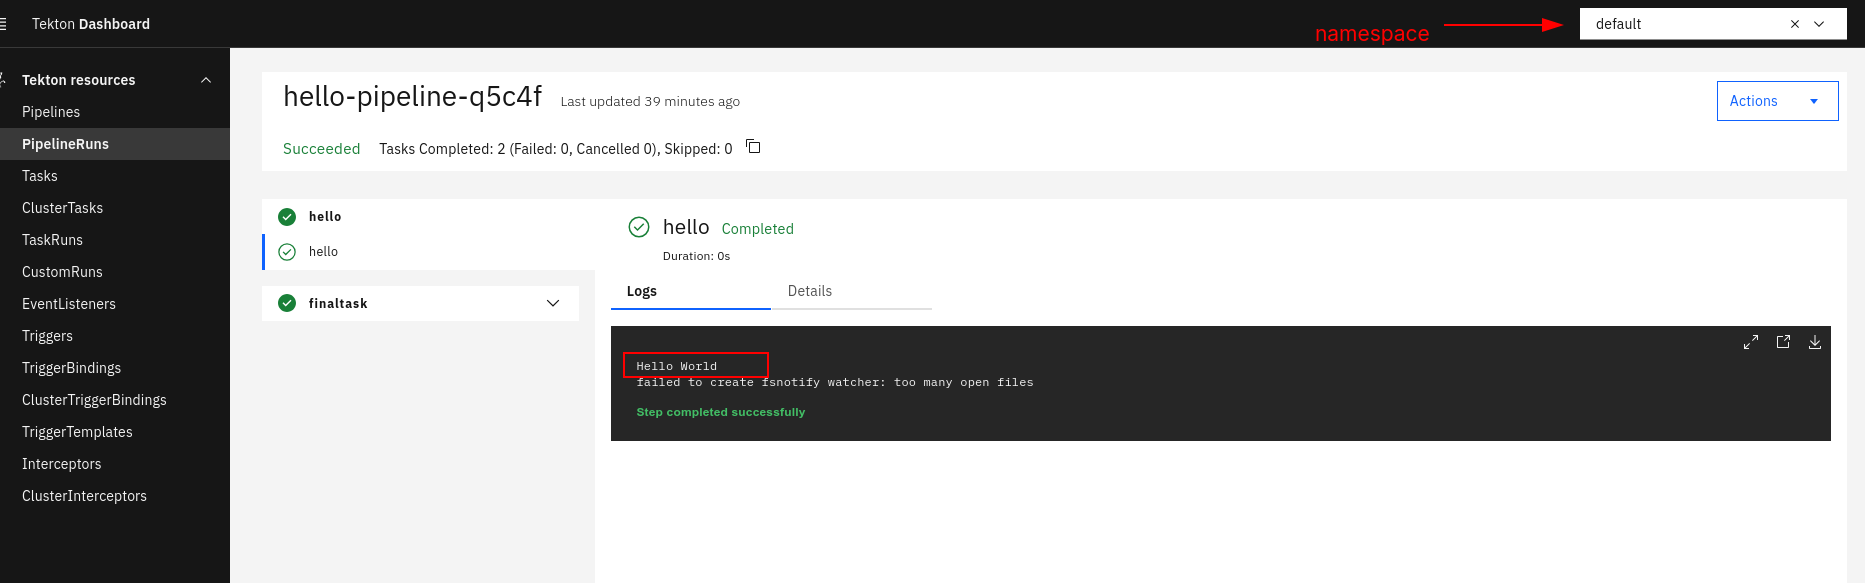
Vamos a ver las tasks, tasksrun, pipeline, pipelinerun y otros filtrando incluso por namespace
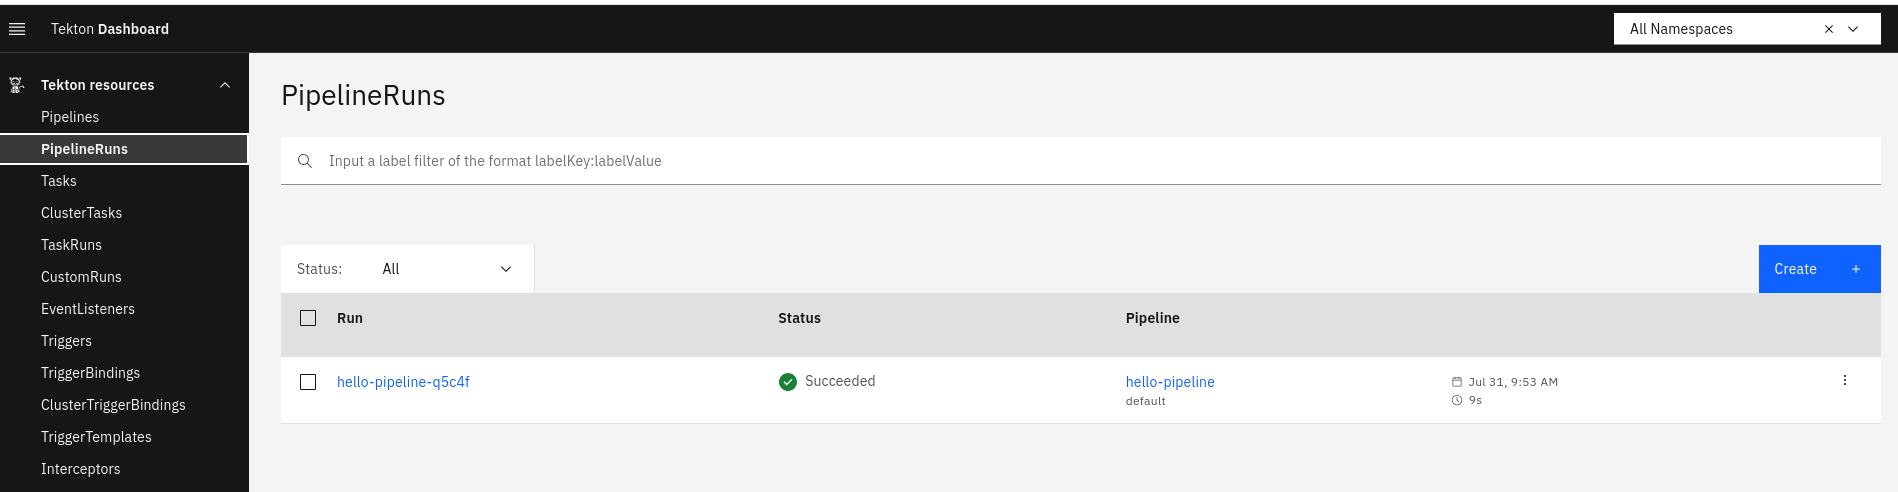
Podemos comprobar los logs incluso por namespace.
Por ahora no es posible crear o editar pipelines visualmente, pero es posible visualizar los yamls. Es posible crear pipelineRun y taskRun con algunas limitaciones.
Voy a poner aquí como deuda técnica entender un poco las limitaciones del dashboard.