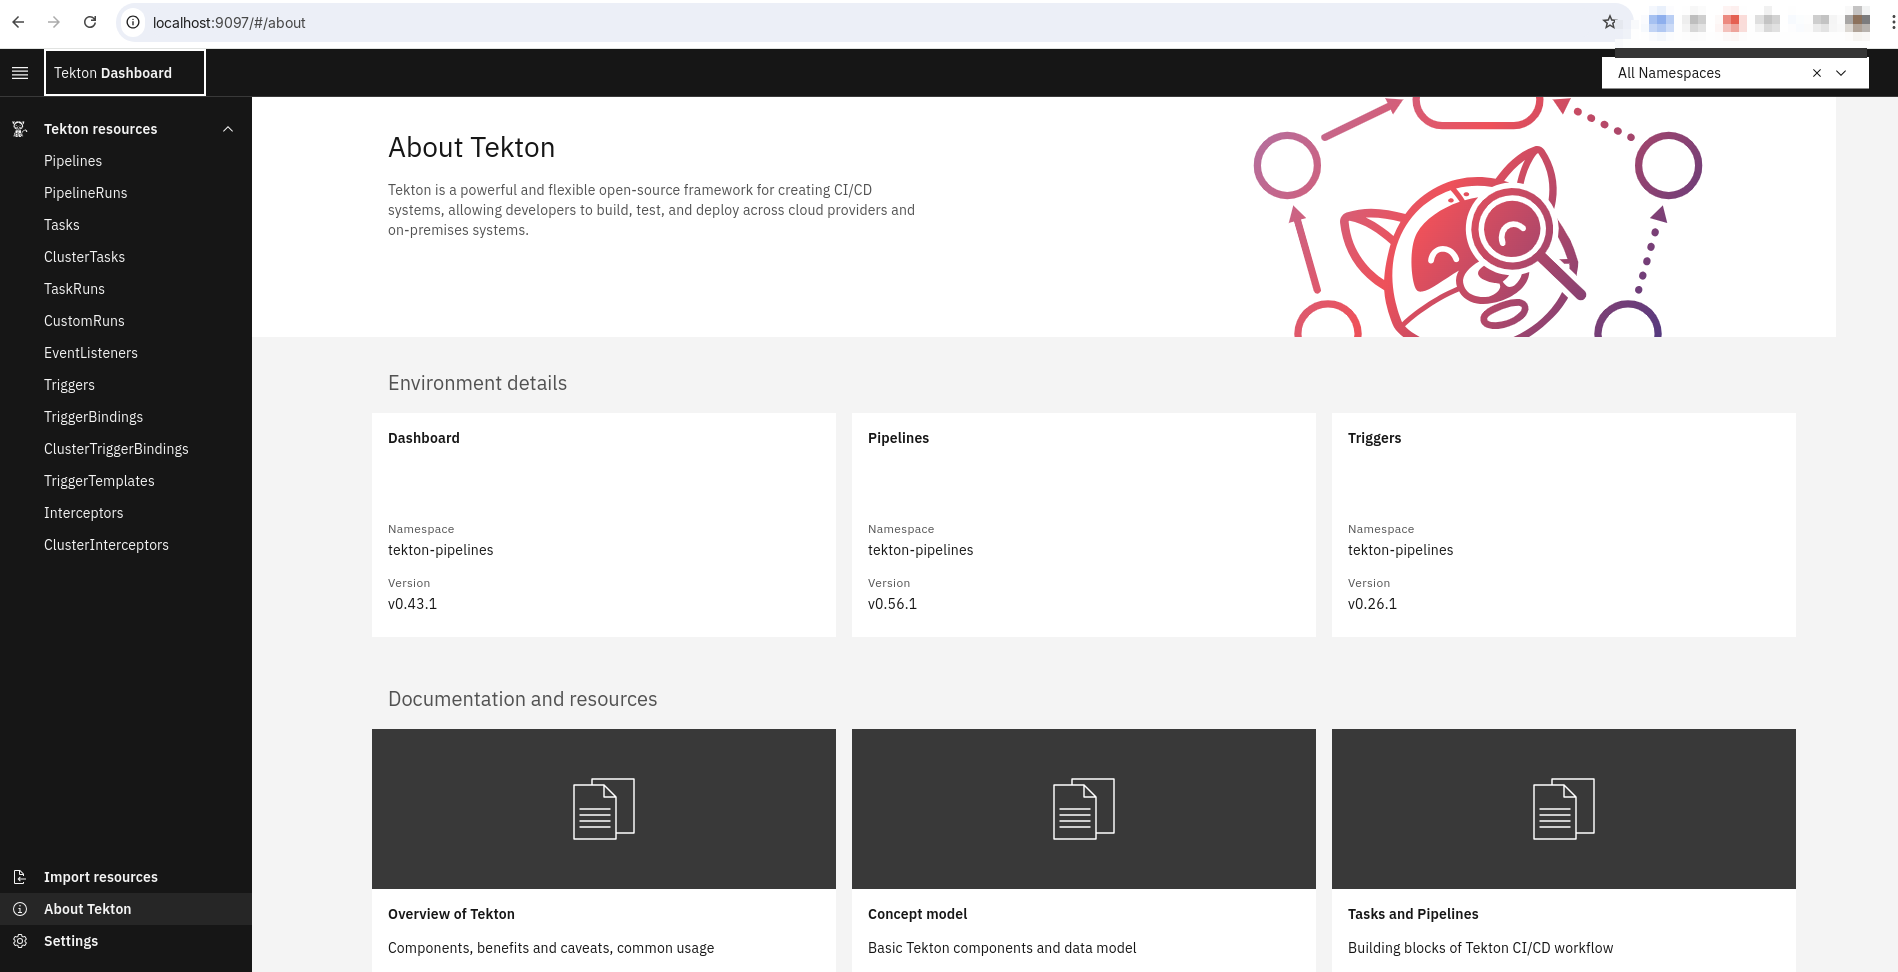
Dashboard
Let's check out the dashboard a bit. Let's find the service and expose the port
k get svc -n tekton-pipelines
NAME                                TYPE        CLUSTER-IP       EXTERNAL-IP   PORT(S)                              AGE
tekton-chains-metrics               ClusterIP   10.97.25.22      <none>        9090/TCP                             10h
tekton-dashboard                    ClusterIP   10.100.96.146    <none>        9097/TCP                             10h
tekton-events-controller            ClusterIP   10.105.115.210   <none>        9090/TCP,8008/TCP,8080/TCP           10h
tekton-operator-proxy-webhook       ClusterIP   10.102.16.99     <none>        443/TCP                              10h
tekton-pipelines-controller         ClusterIP   10.96.179.193    <none>        9090/TCP,8008/TCP,8080/TCP           10h
tekton-pipelines-remote-resolvers   ClusterIP   10.104.95.223    <none>        9090/TCP,8008/TCP,8080/TCP           10h
tekton-pipelines-webhook            ClusterIP   10.106.146.247   <none>        9090/TCP,8008/TCP,443/TCP,8080/TCP   10h
tekton-triggers-controller          ClusterIP   10.110.79.44     <none>        9000/TCP                             10h
tekton-triggers-core-interceptors   ClusterIP   10.96.76.242     <none>        8443/TCP                             10h
tekton-triggers-webhook             ClusterIP   10.109.205.230   <none>        443/TCP                              10h

# We see above that the dashboard listens on port 9097 so let's do a local port-forward to have access on localhost:9097
k -n tekton-pipelines port-forward svc/tekton-dashboard 9097:9097
Forwarding from 127.0.0.1:9097 -> 9097
Forwarding from [::1]:9097 -> 9097
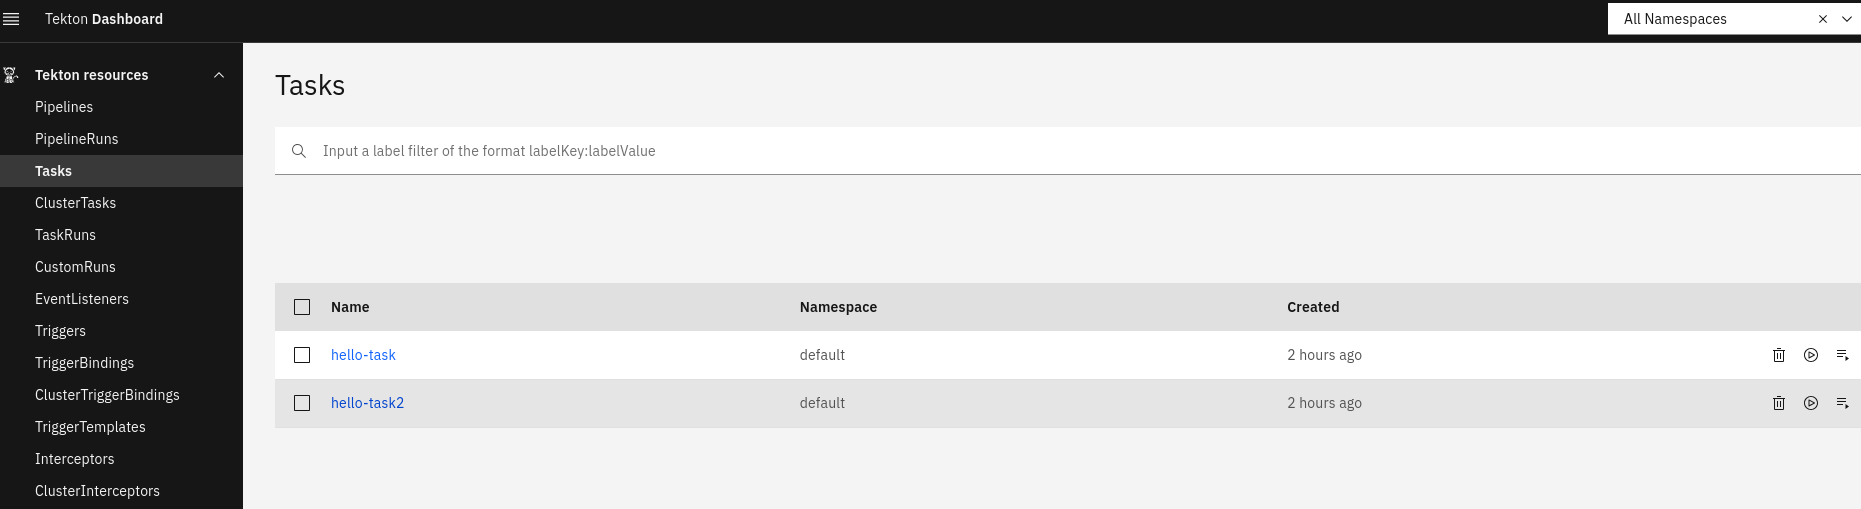
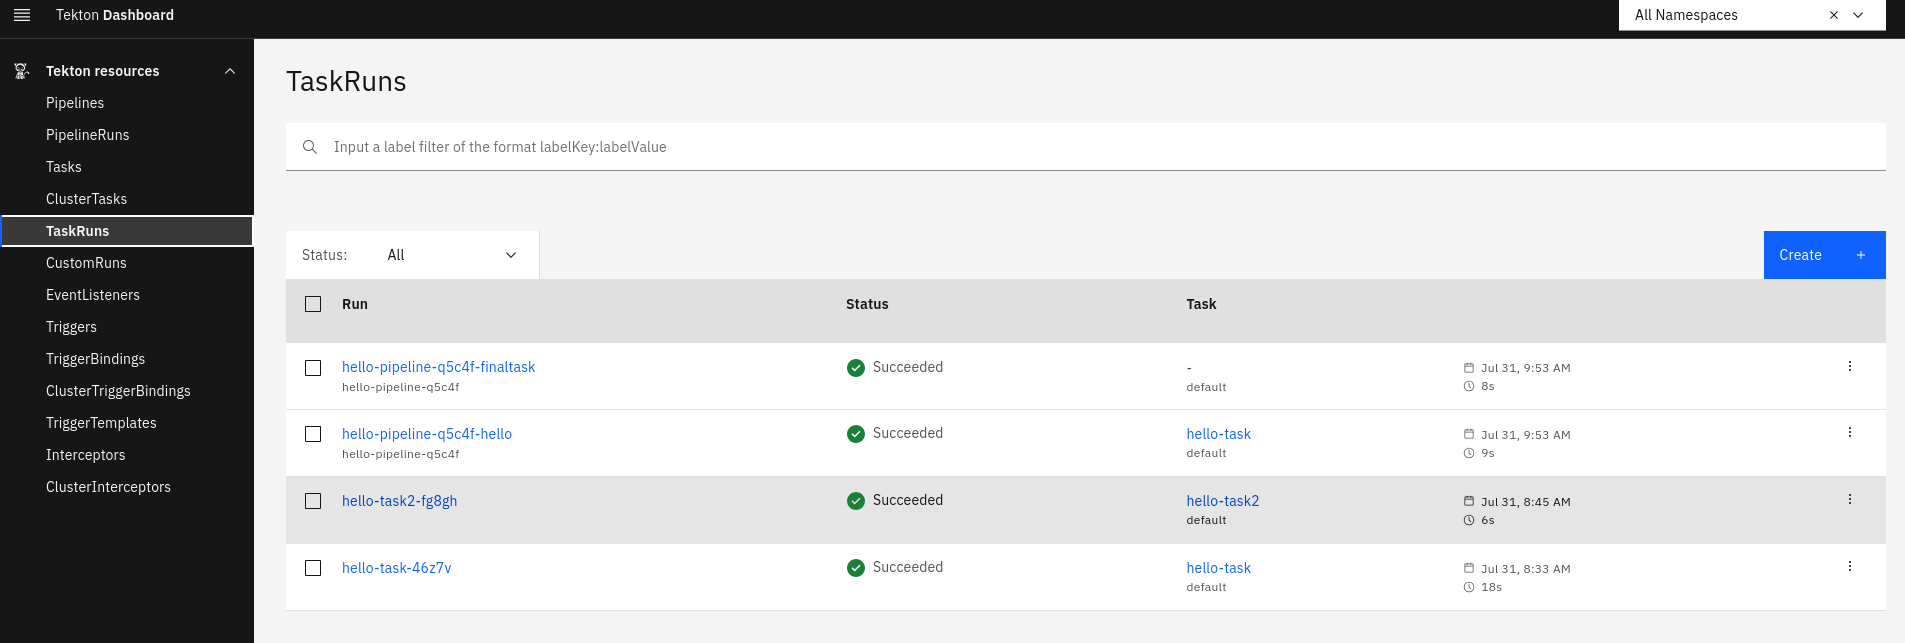
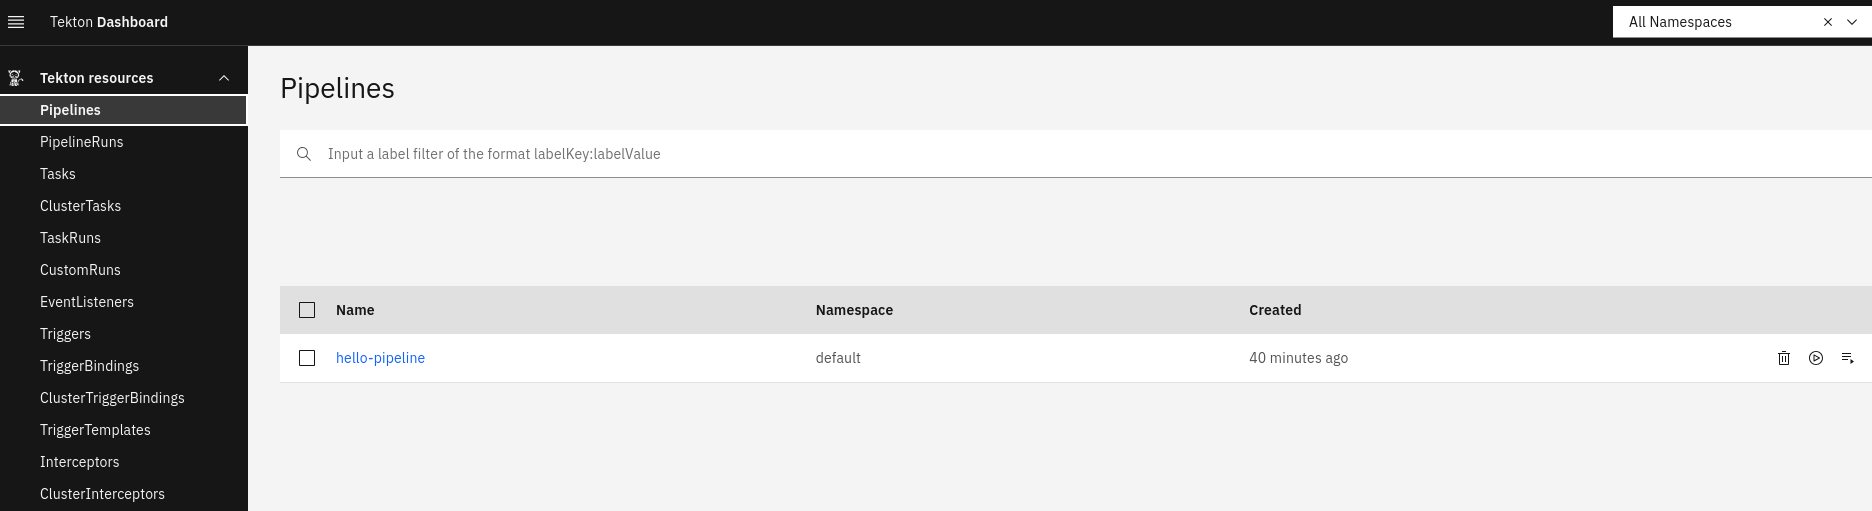
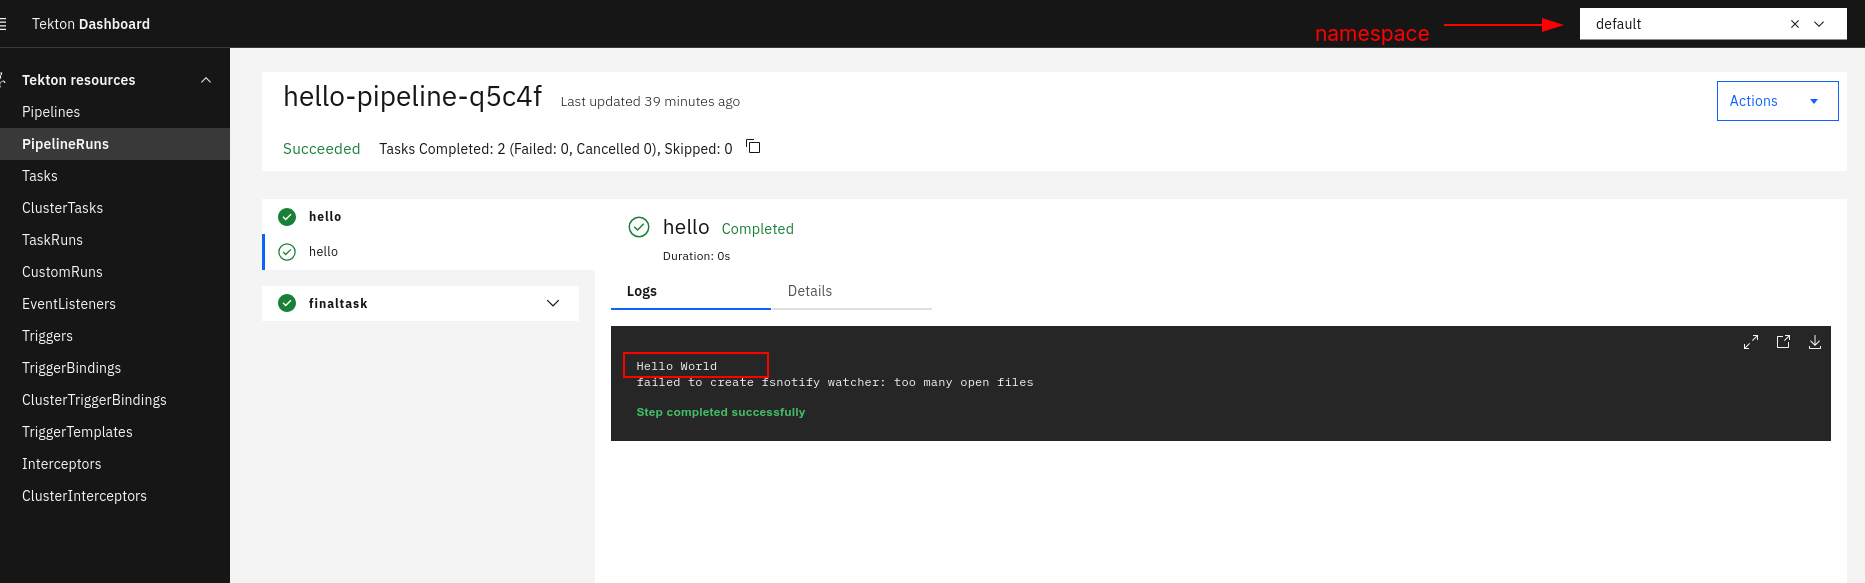
Let's see the tasks, tasksrun, pipeline, pipelinerun and others filtering even by namespace
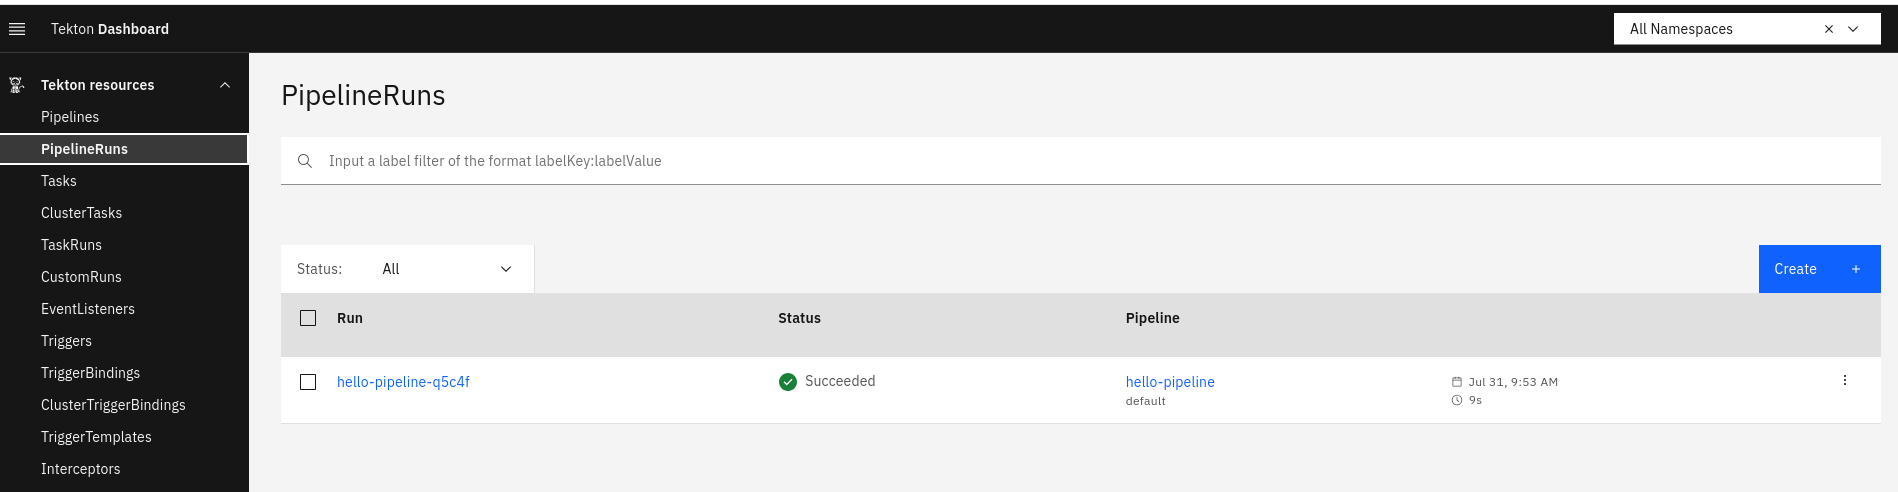
We can check the logs even by namespace.
For now it's not possible to create or edit pipelines visually, but it's possible to view the yamls. It's possible to create pipelineRun and taskRun with some limitations.
I'll put here as technical debt to understand a bit more about the dashboard's limitations.