Adding OpenTelemetry
Once you have the base project in hand, we can add instrumentation to this code. Here we have a step-by-step guide on how to use the OTel SDK with NodeJS.
In the project folder we need to install some dependencies.
npm install @opentelemetry/sdk-node \
  @opentelemetry/api \
  @opentelemetry/auto-instrumentations-node \
  @opentelemetry/sdk-metrics \
  @opentelemetry/sdk-trace-node
This will update the package.json which contains all the packages available for the code when we do npm install that creates the node_modules folder that we can use in our code.
To avoid having to put this in both the auth and todos code, we'll create the instrumentation.js which will be the instrumenter and we'll instantiate it in auth and todos.
/*instrumentation.ts*/
// Imports the necessary OpenTelemetry modules
// NodeSDK is the main component for telemetry configuration
import { NodeSDK } from '@opentelemetry/sdk-node';
// Provides automatic instrumentation for common Node.js modules
import { getNodeAutoInstrumentations } from '@opentelemetry/auto-instrumentations-node';
// Trace exporter in OTLP format (OpenTelemetry Protocol)
import {OTLPTraceExporter} from '@opentelemetry/exporter-trace-otlp-proto';

// Function that initializes OpenTelemetry instrumentation
// Receives the service name as a parameter
function start(serviceName: string) {
   // Configures the exporter to send traces to Jaeger
   // through the OTLP protocol on port 4318
   const traceExporter = new OTLPTraceExporter({
     url: 'http://jaeger:4318/v1/traces',
   });

   // Creates and configures a new OpenTelemetry SDK instance
   const sdk = new NodeSDK({
     traceExporter,            // Trace exporter configured above
     serviceName:serviceName,  // Service name for identification
     instrumentations: [getNodeAutoInstrumentations()] // Enables automatic instrumentation
 });

 // Starts the SDK to begin collecting and exporting telemetry
 sdk.start();
}

// Exports the start function to be used in other modules
export default start
For this project we'll use an exporter instead of using a collector, meaning we'll send directly to Jaeger that we'll also spin up by adding it to docker-compose.yml.
version: '3.8'

services:
  todo:
    build:
      context: .
      dockerfile: docker/Dockerfile.todo
    volumes:
      - .:/usr/src/app:rw
      - /usr/src/app/node_modules
    ports:
      - 8081:8080
    depends_on:
      - redis

  auth:
    build:
      context: .
      dockerfile: docker/Dockerfile.auth
    volumes:
      - .:/usr/src/app:rw
      - /usr/src/app/node_modules
    ports:
      - 8080:8080

  redis:
    image: redis:alpine
    ports:
      - '6380:6379'

  jaeger:
    image: jaegertracing/all-in-one
    ports:
      - 4318
      - 16686:16686
    environment:
      COLLECTOR_OTLP_ENABLED: true
However, it's necessary to start this instrumenter in both the auth and todos services before the other services start.
auth-service.ts
import start from './instrumentation';
start('auth-service')
// Rest of the code...
todos-service.ts
import start from './instrumentation';
start('todo-service')
// Rest of the code...
Each application needs to have a unique name so we can know where it's coming from and separate the systems. If you keep the same name, it will show everything in a single color in Jaeger later.
Now we can bring up docker compose again.
docker compose up --build
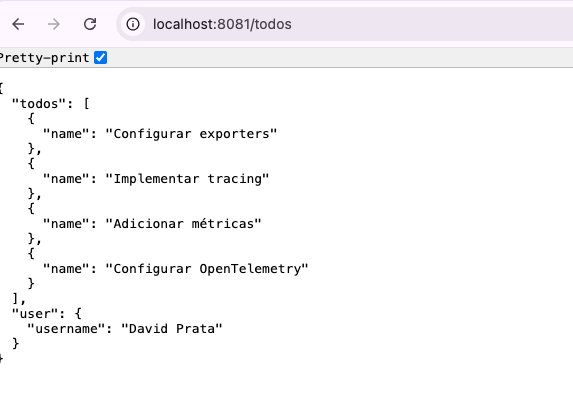
In the browser access localhost:8081/todos to observe the response.
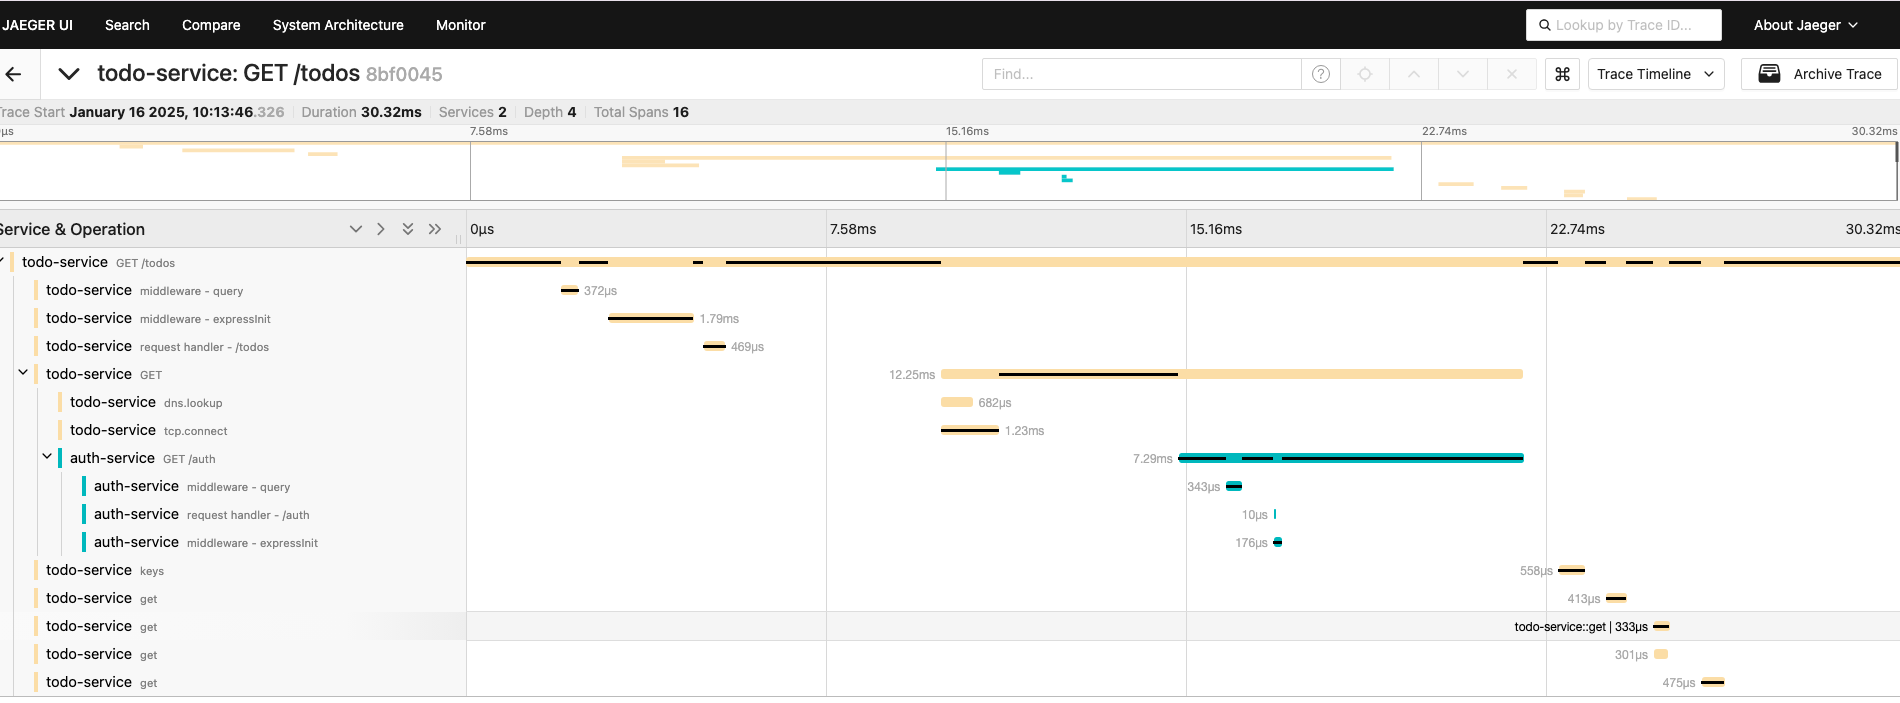
And let's check what happened in Jaeger which runs on localhost:16686. We already have our first trace.
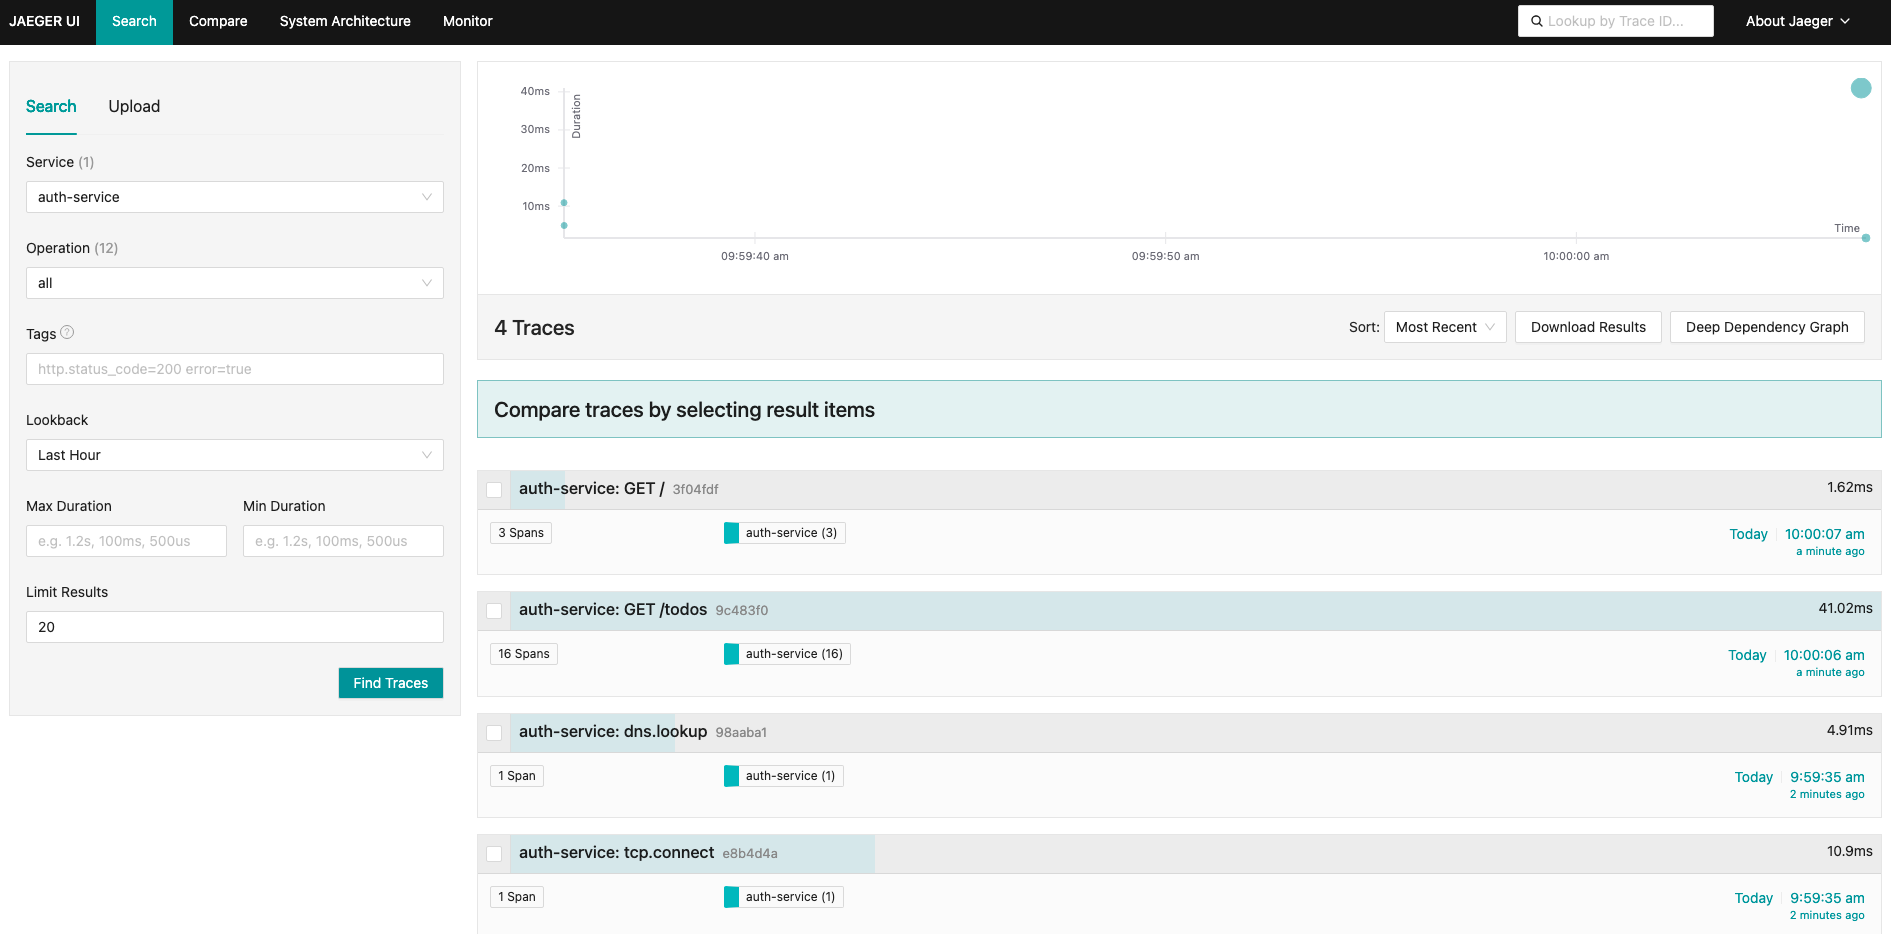
Notice that the colors are different (blue and yellow) precisely because we're using different names in the exporters.
This part of the project is in the base_com_otel branch.