Span Attributes
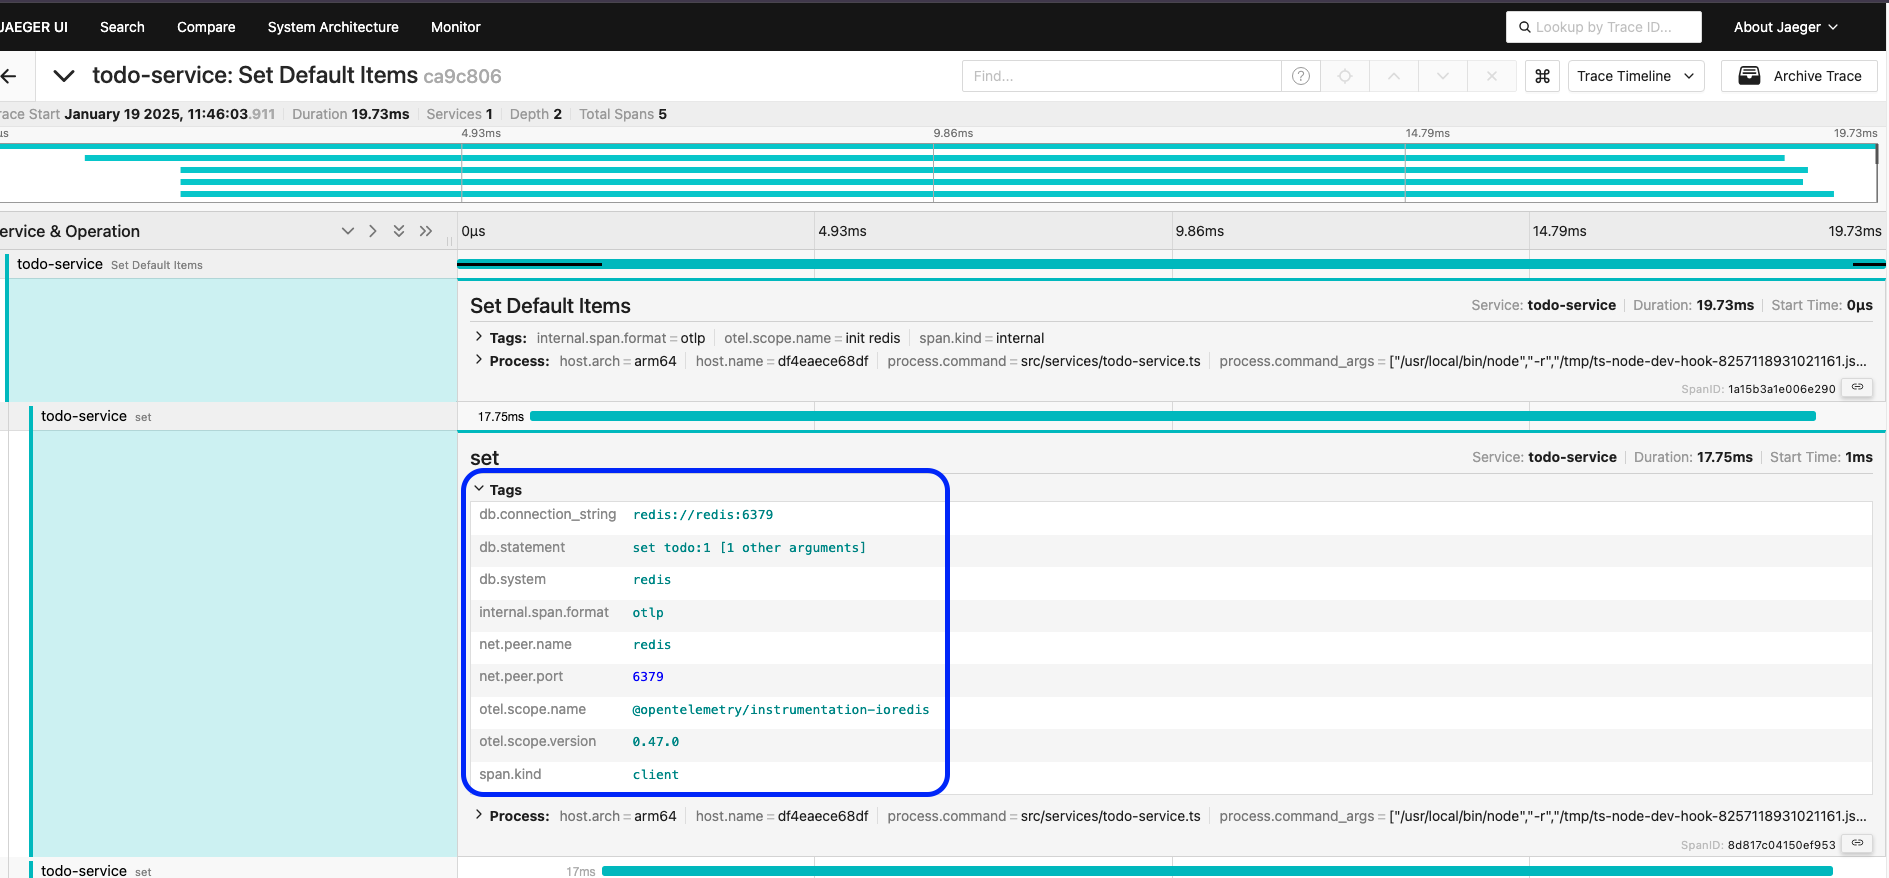
They are a key-value set, shown as tags in Jaeger, that inform us what happened in this span. They provide additional context and detailed information about a specific operation.
Below we can see which database the connection was to, the port used, etc. Additionally, in the process tab we can see information about the runtime and the environment where this span was executed.
Some practical examples of span attributes that are generated.
In HTTP requests:
{
    "http.method": "GET",
    "http.url": "/api/users",
    "http.status_code": 200,
    "http.user_agent": "Mozilla/5.0..."
}
In database operations:
{
    "db.system": "postgresql",
    "db.name": "users_db",
    "db.statement": "SELECT * FROM users",
    "db.user": "app_user"
}
In distributed systems:
{
    "service.name": "payment-service",
    "service.version": "1.2.0",
    "deployment.environment": "production"
}
We can use these values for filtering so that it's easier to search for what we want and understand more about this time interval.
Until now these attributes have been automatically generated by the instrumentation we did, but we can extend to more attributes of our interest. Most of the time, the items you'll add are specifically related to your application.
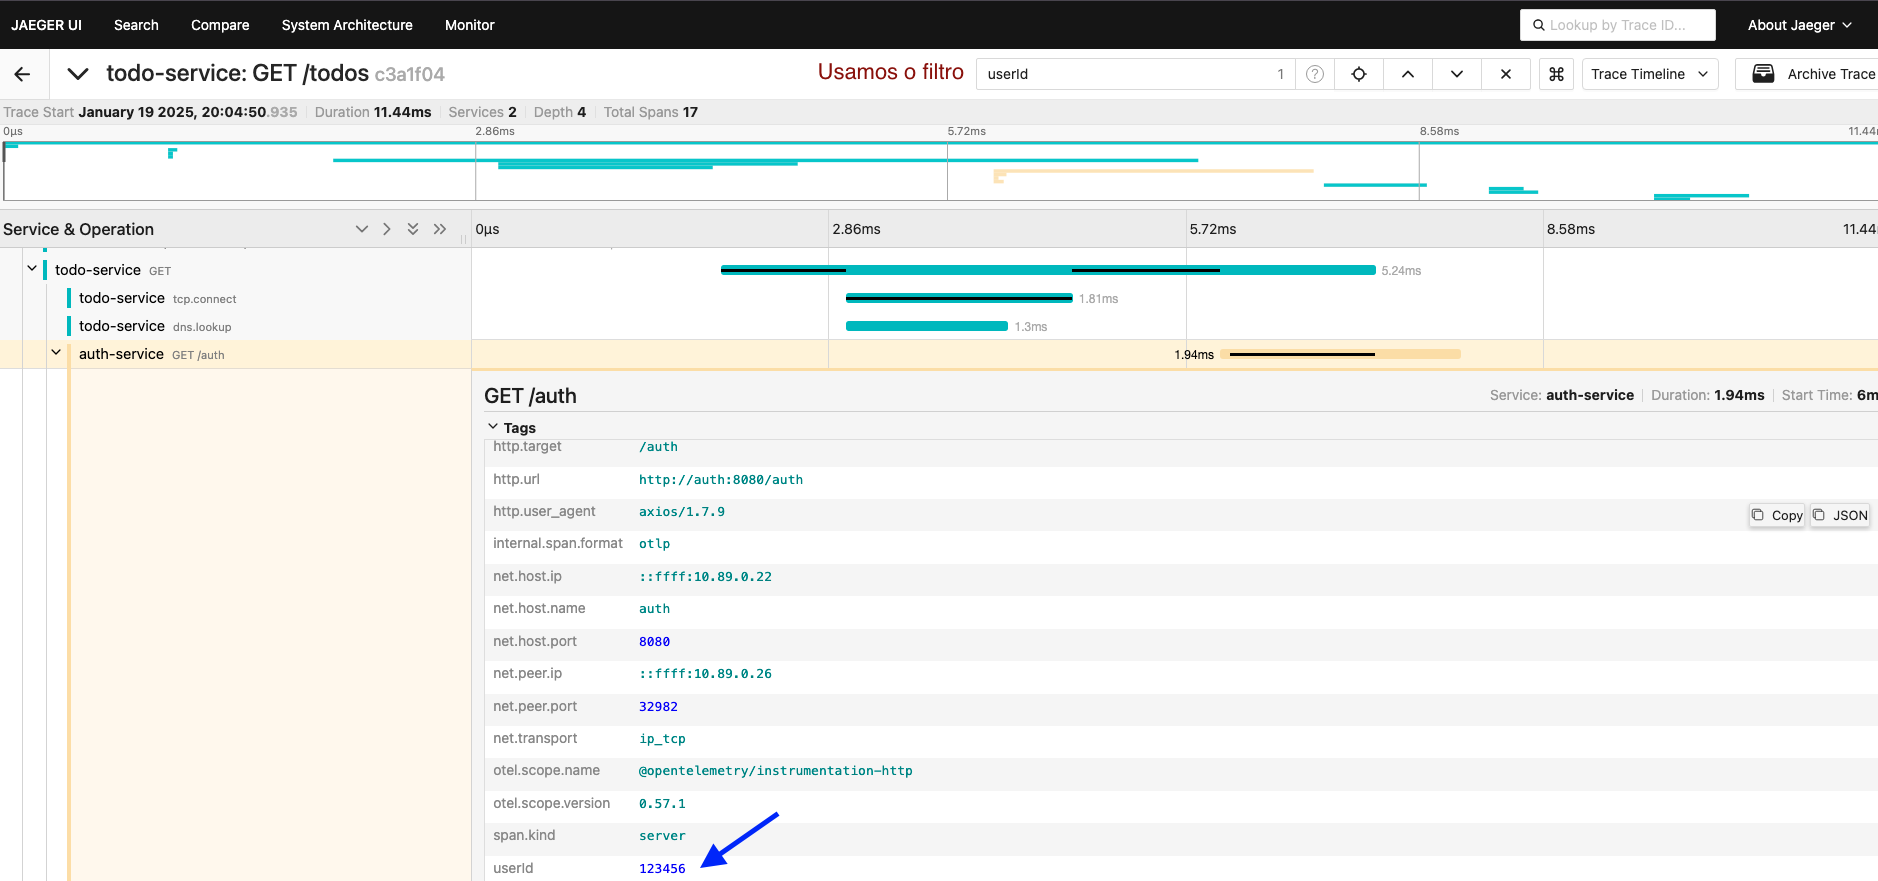
We could add a userId behind this tracking. Most of the traces that are collected happened because our end customer did something in our system. Knowing which user caused this trace will be very useful when trying to debug something.
Let's go to our code in auth-service.ts. What we do is basically define the user in this section.
app.get('/auth', (req, res) => {
    // I've added the userID now
    res.json({ username: 'David Prata', userId: 12345 });
});
Let's create an attribute. It's worth remembering that there are cases where the activeSpan won't exist and depending on the language you're using, it's necessary to check before setting the attribute.
import opentelemetry from "@opentelemetry/api"; // Remember to import!

app.get('/auth', (req, res) => {

    res.json({ username: 'David Prata', userId: 123345 });
    // We could set an attribute as a map for multiple values if necessary, here we'll just use userId
    opentelemetry.trace.getActiveSpan()?.setAttribute('userId', 123456);
});
Let's call curl again and see what we have in Jaeger.
❯ curl http://localhost:8081/todos | jq
  % Total    % Received % Xferd  Average Speed   Time    Time     Time  Current
                                 Dload  Upload   Total   Spent    Left  Speed
100   191  100   191    0     0  13618      0 --:--:-- --:--:-- --:--:-- 13642
{
  "todos": [
    {
      "name": "Add metrics"
    },
    {
      "name": "Configure OpenTelemetry"
    },
    {
      "name": "Implement tracing"
    },
    {
      "name": "Configure exporters"
    }
  ],
  "user": {
    "username": "David Prata",
    "userId": 123345 ## Our initial modification has already appeared here.
  }
}
And this way it will be much easier to search for any incident.