Building Custom Metrics
Let's build a custom metric. The code will be available in the personal_metrics branch.
Once we define our instrumentor, we see that we're using a return that delivers an instantiated meter
  // Start the SDK - begin collecting telemetry
  sdk.start();
  return { meter, meterProvider } // <<<<<
In the todo-service.ts code we can use these instances.
// start('todo-service')
const { meter } = start('todo-service');
And from that we can begin. Just to clarify, app.use() in Express serves as an interception and processing system for requests before they reach the final routes. It's widely used to intercept HTTP requests, process or modify a request before it reaches the final route, execute common actions for multiple routes, add a processing layer, etc.
Let's instantiate the entry time before starting the request and another at the end and subtract to get the processing time.
// Creating a Histogram type metric with the name latency-call
const latencyCall = meter.createHistogram('latency_call', {
    description: 'Latency of /todos endpoint calls in milliseconds'
});

app.use((req, res, next) => {
    // Capture the request start time
    const startTime = Date.now();

    // Add a listener for when the request finishes
    req.on('end', () => {
        // Capture the request end time
        const endTime = Date.now();

        // Record the call metrics
        latencyCall.record(endTime - startTime, {
            route: req.route?.path,      // Route that was accessed
            status: res.statusCode,       // Response status code
            method: req.method            // HTTP method used (GET, POST, etc)
        })
    })
    // Continue processing the request
    next();
})
With just this, it will be possible to have a measure of the processing time for each request.
But let's also create a counter for the number of times this endpoint was accessed.
const requestCounter = meter.createCounter('todos_requests_total', {
    description: 'Total number of requests to /todos endpoint'
});
And let's increment every time we enter /todos.
//... Previous code...
app.get('/todos', async (req, res) => {
    requestCounter.add(1); // Incrementing
    const user = await axios.get('http://auth:8080/auth');
//... Rest of the code
To simulate, we'll pass two parameters. If fail is passed then we'll return 500 and if slow is passed we'll make it sleep for 1 second.
So we have our complete code.
import start from './instrumentation';
// start('todo-service')
const { meter } = start('todo-service');

import express from 'express';
import axios from 'axios';
import IORedis from 'ioredis';

const app = express();
const redis = new IORedis({ host: 'redis' });

// Our two metrics
const latencyCall = meter.createHistogram('latency_call', {
    description: 'Latency of /todos endpoint calls in milliseconds'
});

const requestCounter = meter.createCounter('todos_requests_total', {
    description: 'Total number of requests to /todos endpoint'
});

// Will always be executed before and at the end to capture the time.
app.use((req,res,next)=>{
    const startTime = Date.now();
    req.on('end',()=>{
        const endTime = Date.now();
        latencyCall.record(endTime-startTime,{
            route: req.route?.path,
            status: res.statusCode,
            method: req.method
        })
    })
    next();
})

// We define a sleep function just to be used in the todos endpoint.
const sleep = (time:number)=>{return new Promise((resolve)=>{setTimeout(resolve,time)})};

app.get('/todos', async (req, res) => {
    requestCounter.add(1); // Increment the counter
    const user = await axios.get('http://auth:8080/auth');
    const todoKeys = await redis.keys('todo:*');
    const todos: any[] = [];

    for (const key of todoKeys) {
        const todoItem = await redis.get(key);
        if (todoItem) {
            todos.push(JSON.parse(todoItem));
        }
    }
    // If it has the slow query, sleep for 1 second
    if(req.query['slow']){
        await sleep(1000);
    }

    // If it has the fail query, stop everything and return 500
    if(req.query['fail']){
        await console.error('Really Bad error!');
        res.sendStatus(500);
        return
    }

    res.json({ todos, user: user.data });
});

app.listen(8080, () => {
    console.log('Todo service is running on port 8080');
});

// Initialize some todos for testing
async function init() {
    await Promise.all([
        redis.set('todo:1', JSON.stringify({ name: 'Configure OpenTelemetry' })),
        redis.set('todo:2', JSON.stringify({ name: 'Implement tracing' })),
        redis.set('todo:3', JSON.stringify({ name: 'Add metrics' })),
        redis.set('todo:4', JSON.stringify({ name: 'Configure exporters' }))
    ]);
}

init().catch(console.error);
Let's run it.
docker compose up --build
And make some requests
curl http://localhost:8081/todos
{"todos":[{"name":"Add metrics"},{"name":"Configure OpenTelemetry"},{"name":"Implement tracing"},{"name":"Configure exporters"}],"user":{"username":"David Prata"}}

curl http://localhost:8081/todos
{"todos":[{"name":"Add metrics"},{"name":"Configure OpenTelemetry"},{"name":"Implement tracing"},{"name":"Configure exporters"}],"user":{"username":"David Prata"}}

curl http://localhost:8081/todos
{"todos":[{"name":"Add metrics"},{"name":"Configure OpenTelemetry"},{"name":"Implement tracing"},{"name":"Configure exporters"}],"user":{"username":"David Prata"}}

curl http://localhost:8081/todos
{"todos":[{"name":"Add metrics"},{"name":"Configure OpenTelemetry"},{"name":"Implement tracing"},{"name":"Configure exporters"}],"user":{"username":"David Prata"}}

curl http://localhost:8081/todos\?slow
{"todos":[{"name":"Add metrics"},{"name":"Configure OpenTelemetry"},{"name":"Implement tracing"},{"name":"Configure exporters"}],"user":{"username":"David Prata"}}

curl http://localhost:8081/todos\?slow\=1
{"todos":[{"name":"Add metrics"},{"name":"Configure OpenTelemetry"},{"name":"Implement tracing"},
{"name":"Configure exporters"}],"user":{"username":"David Prata"}}

curl http://localhost:8081/todos\?fail
{"todos":[{"name":"Add metrics"},{"name":"Configure OpenTelemetry"},{"name":"Implement tracing"},{"name":"Configure exporters"}],"user":{"username":"David Prata"}}

curl http://localhost:8081/todos\?fail\=1
Internal Server Error
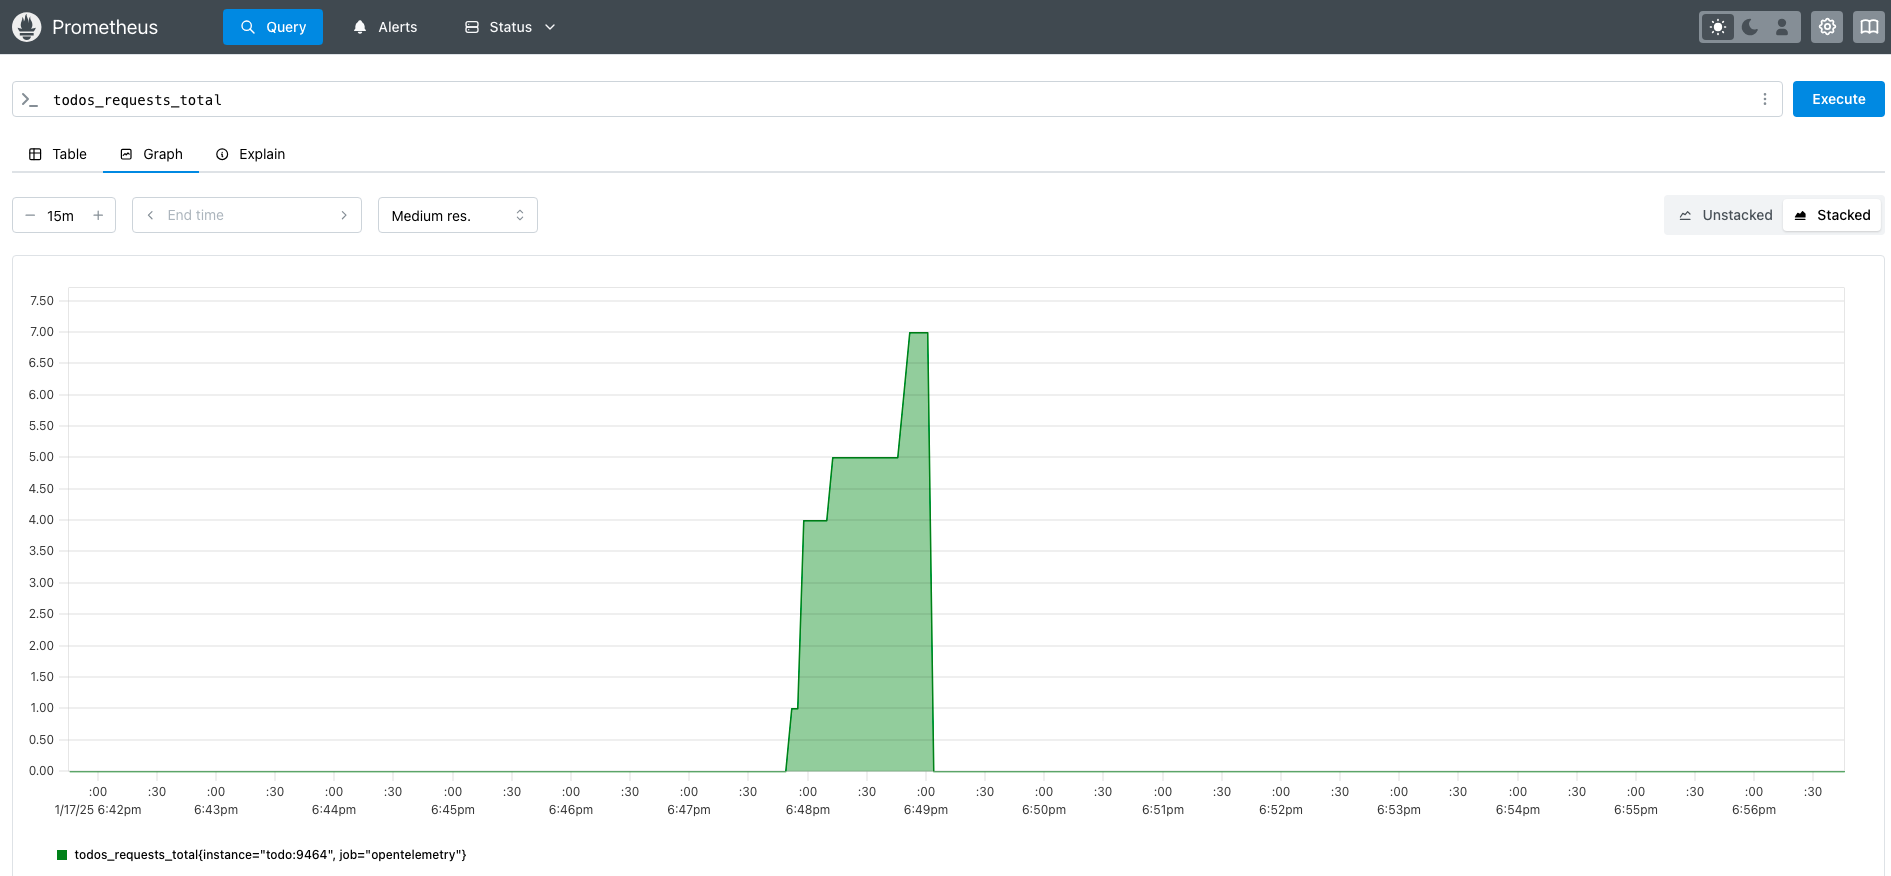
We made 7 requests so we have in Prometheus localhost:9090
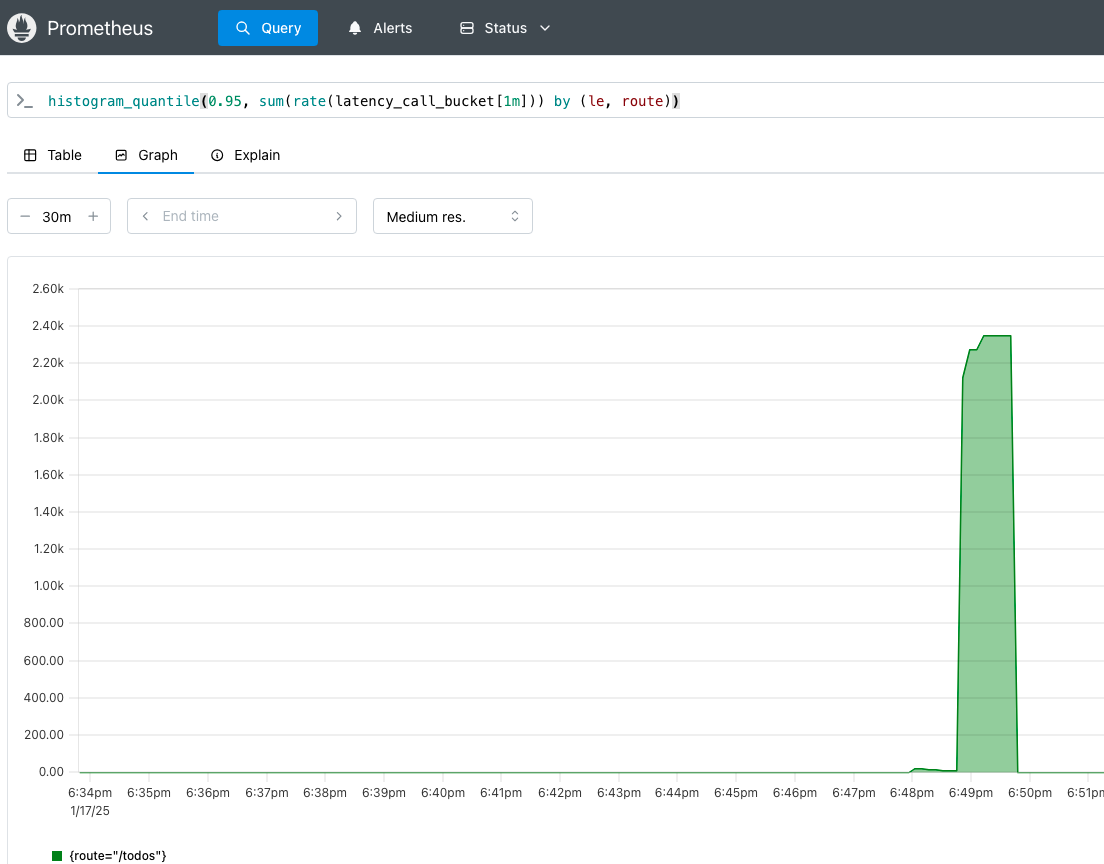
And to see the latency?