Logs and Traces Relationship
When you instrument an application with OpenTelemetry, the trace context is automatically propagated through the application. This means you have a "timeline" of the operations that occur.
- Each request generates a trace that has a unique identifier.
- When a log is generated, they can be automatically correlated with the trace through this identifier
The beauty of this system is that when you need to debug a problem, you can see:
- The complete flow of the request (trace)
- All logs related to that specific execution
- The associated metrics
It's like having a "complete story" of each request, where you can see not only the path it took, but also all the details of what happened at each step.
In the project, if you want to see this change, it will be in the logs branch.
In todo-service.ts we have this.
app.get('/todos', async (req, res) => {
    requestCounter.add(1);
    const user = await axios.get('http://auth:8080/auth');
    const todoKeys = await redis.keys('todo:*');
    const todos: any[] = [];

    for (const key of todoKeys) {
        const todoItem = await redis.get(key);
        if (todoItem) {
            todos.push(JSON.parse(todoItem));
        }
    }

    if(req.query['slow']){
        await sleep(1000);
    }

    if(req.query['fail']){ // Let's talk about this if
        // And here we're logging an error if we pass ?fail=1
        console.error('Really Bad error!');
        res.sendStatus(500);
    }

    res.json({ todos, user: user.data });
});
This log is going to the console, but it would be much better if we could log using the trace context.
Let's change that if to this.
// Let's use the opentelemetry sdk
import { api } from '@opentelemetry/sdk-node';
// Code...

app.get('/todos', async (req, res) => {
    // Code...

    if(req.query['fail']){
        try{
            // Error simulation - throws an exception intentionally
            throw new Error('Really Bad error!')
        } catch (e: any) {
            // Get the current span (interval) from the trace context
            const activeSpan = api.trace.getSpan(api.context.active());
            // Record the exception in the current span, allowing it to appear in the trace
            // If activeSpan exists, then call the recordException method
            activeSpan?.recordException(e) // This is the line that interests us
            // Log the error along with important trace information to the console so we can see it.
            console.error('Really Bad error!', {
                spanId: activeSpan?.spanContext()?.spanId,     // Unique ID of this specific span
                traceId: activeSpan?.spanContext()?.traceId,   // Unique ID of the entire transaction
                traceFlag: activeSpan?.spanContext()?.traceFlags, // Trace flags (e.g., sampling)
            });
            // Return status 500 (internal server error)
            res.sendStatus(500);
            return
        }
        // Code...
    }
});
// Code...
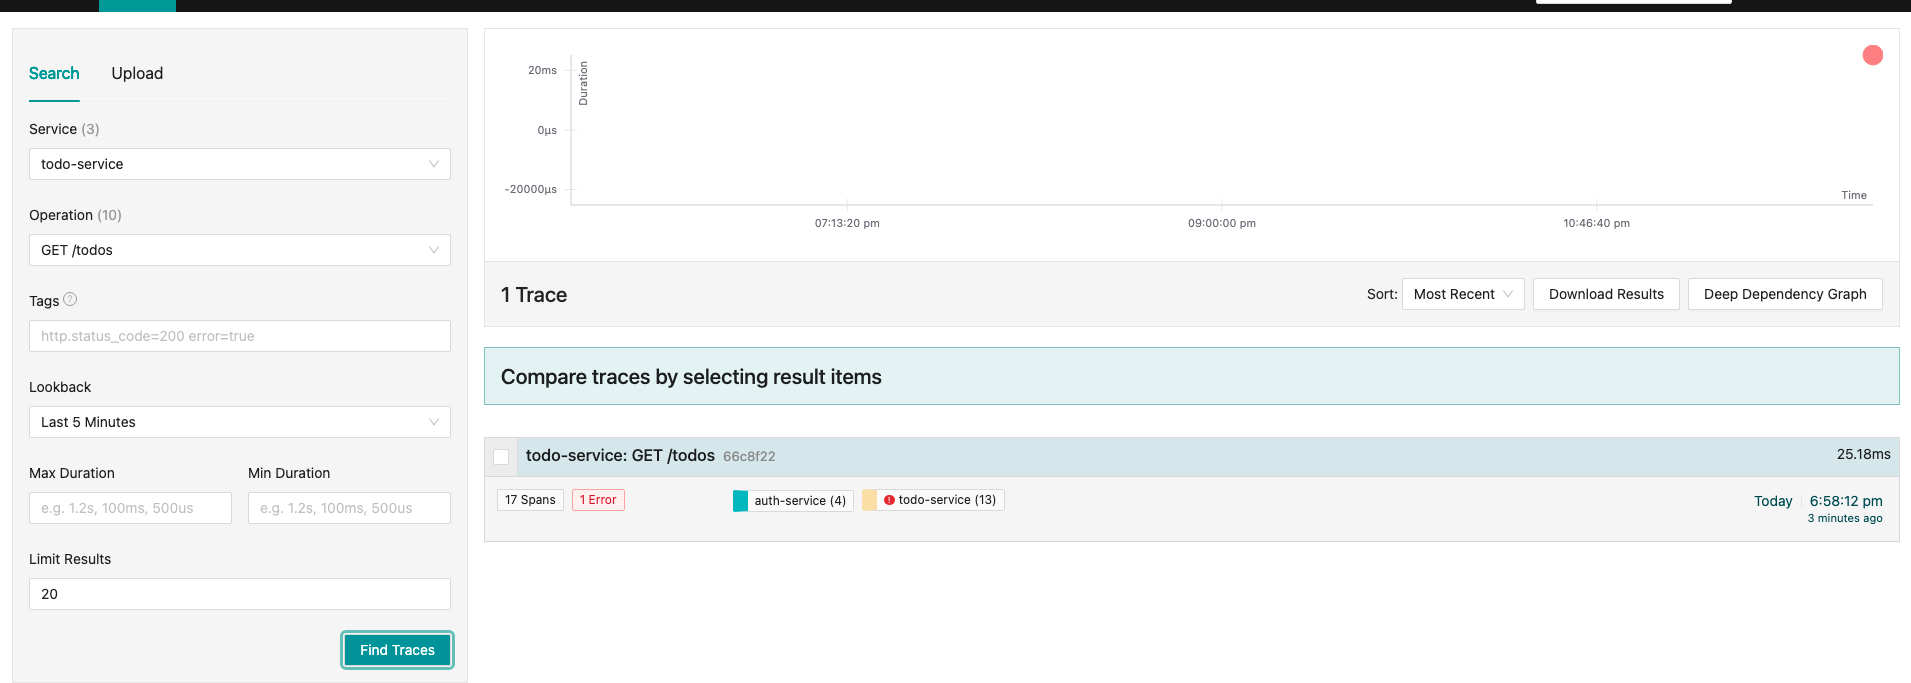
Making the request and checking what we have.
curl http://localhost:8081/todos?fail=1
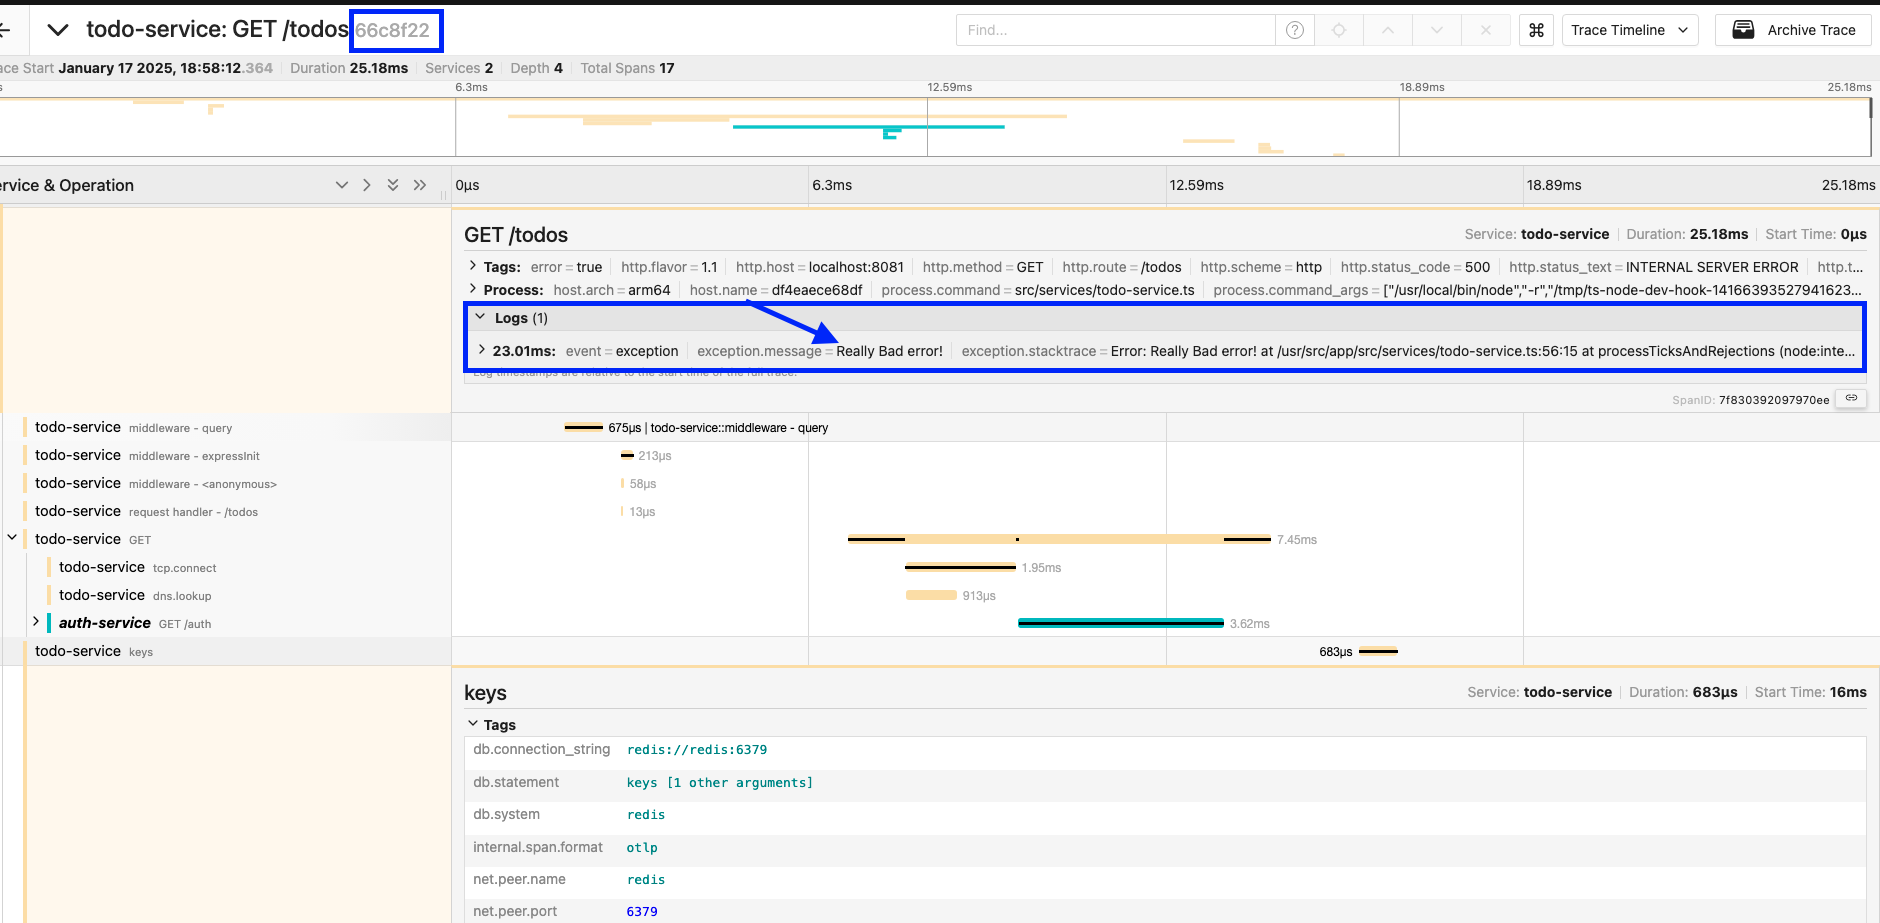
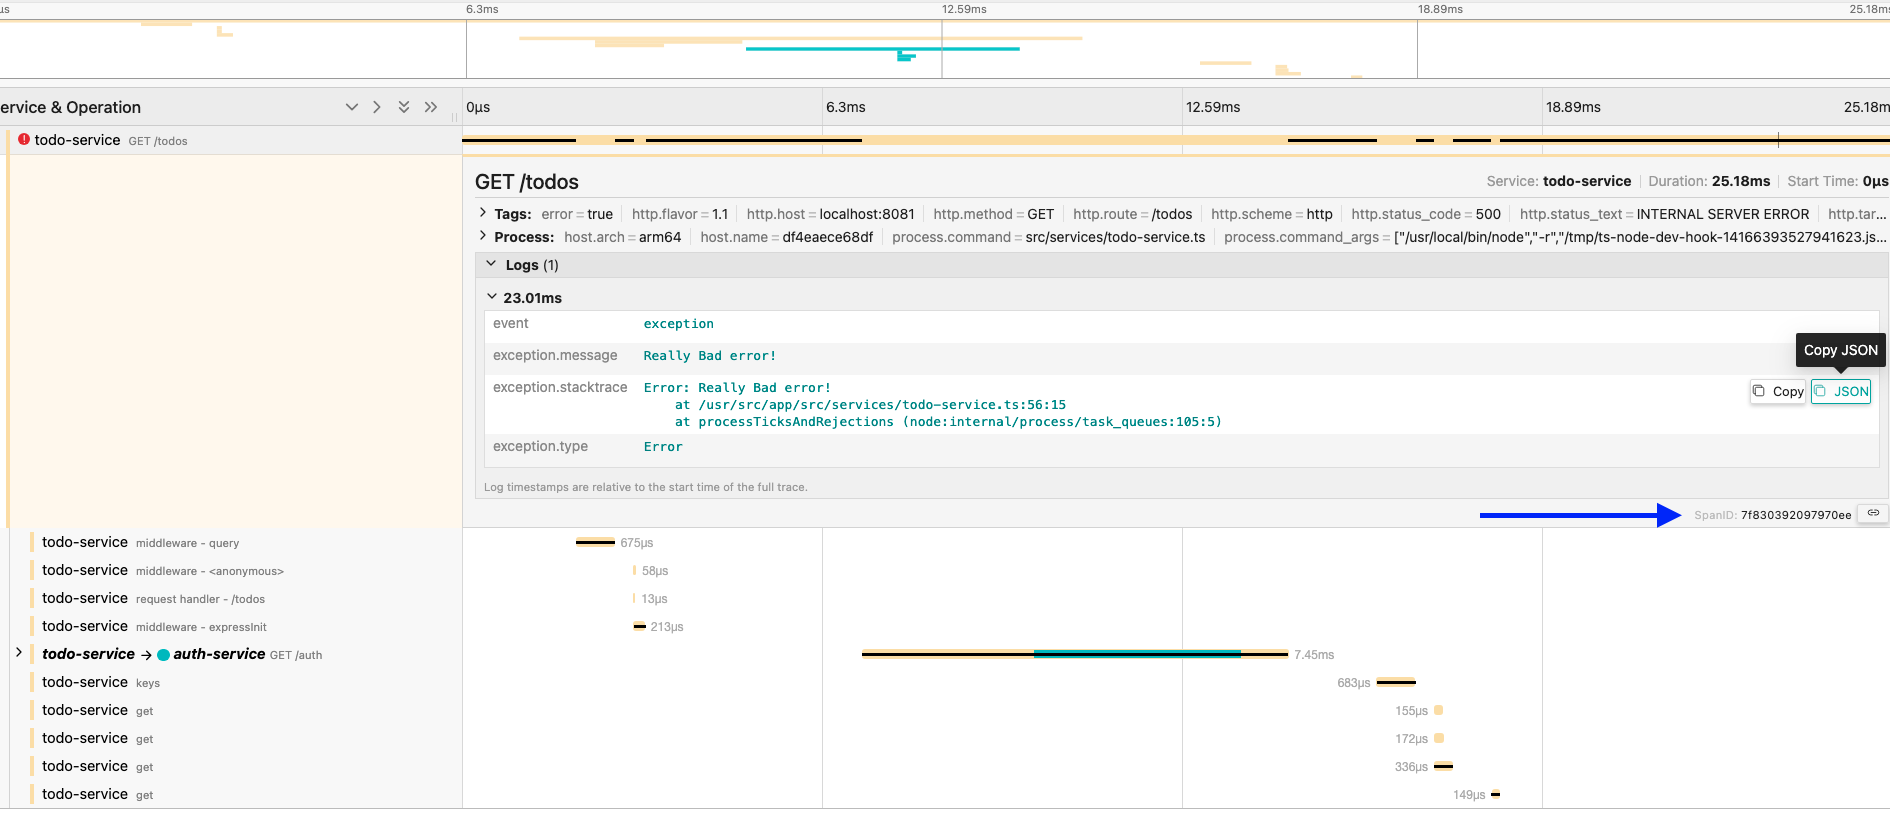
In the compose log we have this log in the console showing our spanId, traceId and traceFlag
todo-1        | Todo service is running on port 8080
todo-1        | prometheus scrape endpoint: http://localhost:9464/metrics
todo-1        | Really Bad error! {
todo-1        |   spanId: '7f830392097970ee',
todo-1        |   traceId: '66c8f22097c5adf08452acea0e8cf23a',
todo-1        |   traceFlag: 1
todo-1        | }
You can (and often it's recommended) add logs at various points in the trace, not just in exceptions as we did above.
You can use the span to record important events throughout the entire code execution. Some examples below.
Normal event logs
activeSpan?.addEvent('Starting database search');
activeSpan?.addEvent('Data found', { attributes: { count: 5 } });
Exception logs (as we did above)
activeSpan?.recordException(error);
State/progress logs
activeSpan?.addEvent('Cache hit');
activeSpan?.addEvent('Processing 50% complete');
Logs with business context
activeSpan?.addEvent('Order processed', {
    attributes: {
        orderId: '123',
        status: 'approved'
    }
});
The idea is that you can use logs to tell the "complete story" of the execution, not just when something goes wrong. This helps a lot in debugging and understanding the system's behavior in production.
This is the moment when we change the way we use logs in distributed applications.
Is it necessary to do this manually? No. If the library for recording logs has instrumentation for opentelemetry, this will be done automatically. In the case of NodeJS, our example project, we have Winston which is very popular, flexible, and supports various formats for transport. But we still have others like Pino, Bunyan, Morgan, etc., each with its own focus and better for different things.
If you don't want to use a library, just create a log function and use it.