Observability Concepts
Observability represents a fundamental shift in how we monitor systems, allowing us to understand them from the outside in. Unlike traditional monitoring, observability enables us to ask questions about the system without necessarily knowing its detailed internal workings. This capability is especially crucial for identifying and resolving not only known problems, but also "unknown unknowns" - those we couldn't anticipate.
To achieve effective observability, systems need to be properly instrumented. Instrumentation consists of the code's ability to emit signals that allow us to understand its behavior. OpenTelemetry (OTel) initially focuses on three fundamental types of signals:
- Traces: Allow visualizing the path of a request through different services
- Metrics: Provide quantitative data about system performance
- Logs: Record specific system events
It's important to note that although OpenTelemetry starts with these three pillars, its architecture was designed to expand and incorporate other types of telemetry as technology evolves.
Modern Computing Context
OpenTelemetry emerged as a response to the specific needs of the cloud-native era, where applications are characterized by:
- Distributed architectures
- Serverless components
- Container execution
- Intense communication between different services
In this context, distributed tracing gains special importance, as it allows visualizing and understanding data flow through multiple services and components.
Observability effectiveness can be directly measured by its impact on business indicators, especially:
- Mean Time To Detection (MTTD): Time to detect a problem
- Mean Time To Resolution (MTTR): Time to resolve a problem
- Service availability (Service Level Objectives - SLOs)
Monitoring Evolution
To contextualize OpenTelemetry's importance, it's useful to compare with the traditional scenario:
Monolithic Applications:
- Single process execution
- Direct database communication
- Centralized diagnostics
- Simplified chronological analysis
Modern Applications:
- Multiple distributed services
- Asynchronous communication
- Complex dependencies
- Need for correlation between different signals
This evolution highlights why traditional monitoring tools are no longer sufficient for modern systems, and why we need a more sophisticated approach like OpenTelemetry.
Difficulties Finding the Problem
In a scenario where we have a monolith that loses communication with the database, we would usually go straight to the logs to look for records of everything that happened, as they were in chronological order and in one place.

The problem starts to appear when one system calls another system that calls another. If we had the following structure, where could the problem be?
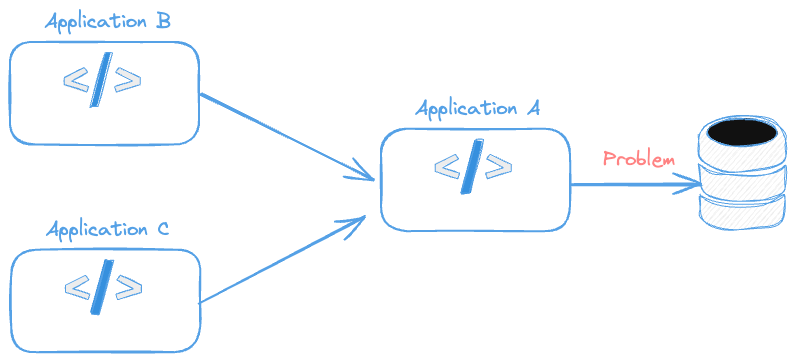
- Application A cannot communicate with the database.
- Application B cannot communicate with Application A and causes some database failure.
- Application C cannot communicate with Application A and causes some database failure.
And this will get increasingly complex.
If we added the information that Application B always works with Application A, we would know B and A work, that is, we have no problem between them and communication with the DB is up. Therefore we would already know the problem is in Application C.
This is what traces help with, understanding the story between different components.
- The log will inform us of the single process history of the application and what happened in that process.
- Metrics help us see the application's health.
- Traces provide context, that is, the path, the distributed path between different components.
This way it will be possible to understand how components are communicating with each other.
Logs
A log is a temporal record of an event that occurred in a system. It's like a "digital note" that contains:
- A timestamp (date and time of the event)
- A message describing what happened
- Usually also includes a severity level (like ERROR, WARN, INFO, DEBUG)
For example, when you log into a website, the system might generate a log like this:
2024-01-14 10:30:15 [INFO] User 'john123' logged in successfully
Logs are independent - that is, they don't necessarily need to be connected to a specific user action or transaction. They can record any type of system event, from errors to routine operations.
An important characteristic of logs is that they are like "snapshots" of specific moments - they record what happened at that instant, but don't automatically show the path that led to that event or what happened afterwards.
Metrics
Metrics are numerical data representing the state or behavior of a system over time. They are quantitative measurements that, when collected and analyzed, help understand the performance, health, and resource utilization of an application or infrastructure.
Common Types of Metrics:
- Counters: Numbers that only increase (e.g.: total requests received)
- Gauges: Values that can increase or decrease (e.g.: active users)
- Histograms: Distribution of values in intervals (e.g.: response time)
Practical Examples:
- Error rate per minute
- CPU and memory usage
- Average request response time
- Number of connected users
- Transactions per second
- Available disk space
- Processing queue size
It's also worth reading about observability service levels to understand where these numbers can help us.
Traces: Distributed Tracing
A trace is like a "story" that shows the complete journey of a request through a distributed system. Imagine a detailed timeline that records each step a request goes through, from the moment it enters the system until its completion.
Fundamental Concepts
Trace is the complete journey of a request. Composed of a series of connected spans and identified by a unique trace ID.
Shows end-to-end flow through different services
A Span represents a single operation within the trace. Can be an HTTP call, database query, or internal processing and contains crucial information:
- Operation name
- Timestamps (start and end)
- Duration
- Operation status
- Attributes (metadata)
- Important events during execution
Spans are organized in a parent-child structure. A parent span can have multiple child spans. Each child span represents a sub-operation of the parent span. For example, when you log into a website, a trace might show:
- Receiving the login request
- Credential validation
- Database query
- Access token generation
- Response return
This structure allows quickly identifying where performance bottlenecks are or where errors occur in distributed systems.
Let's demonstrate a trace visually using Jaeger-UI. Graphically we have something like what we have below. We won't go into details now, but we can see it works with a call tree with parent-child relationships of who called whom.
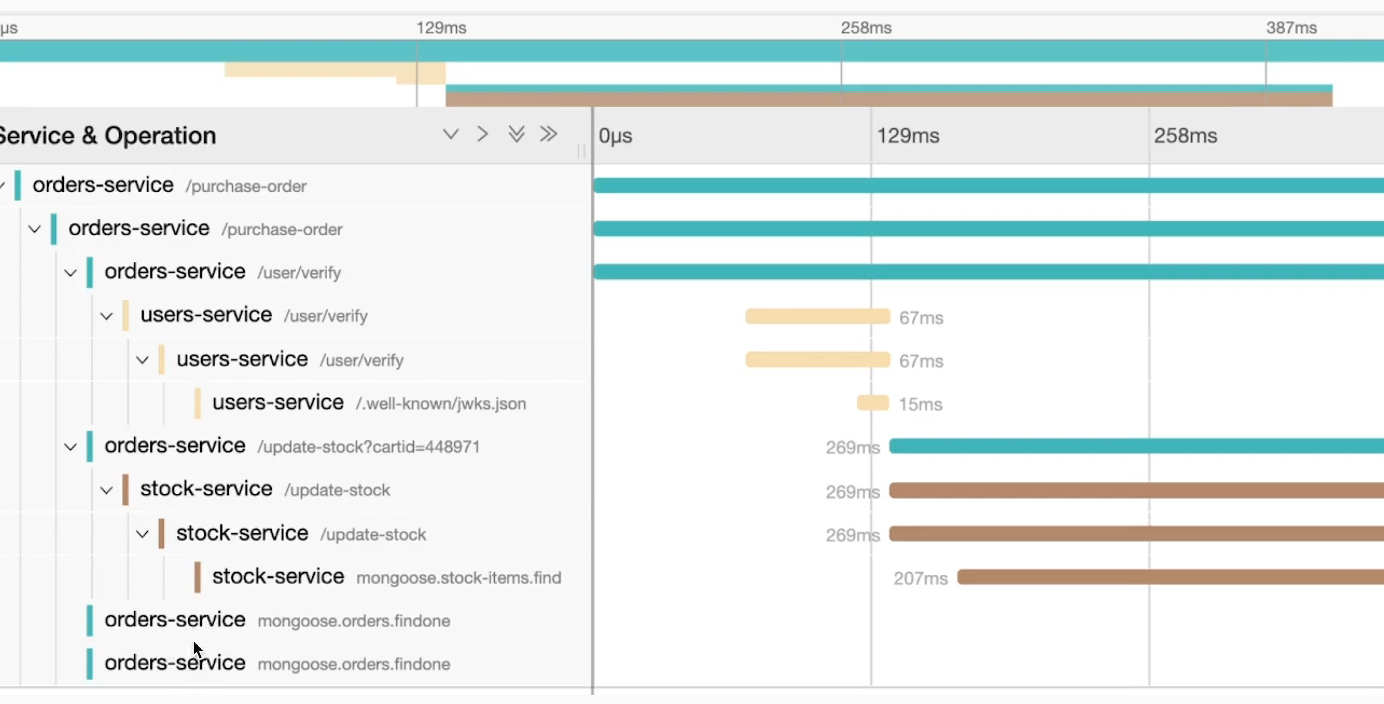
Notice that the trace tells a story of what happened with a call to /purchase-order visually in a tree. On the side we have a timeline to help understand the time things were processed.
What we're seeing here is what we call Context, that is, context of everything that happened from the main call and the time it took to complete everything and the time of each step.
Only after the call to /user/verify was completed in 67ms was the call to /update-stock made.
So we have something like /purchase-order > /user/verify > /update-stock.
With traces we can see what was executed sequentially and what was executed in parallel.