Sampling
One of the problems with OpenTelemetry is controlling cost. Despite being an open source tool, somewhere you will need traffic, processing and storage for the collected data. Whether in your own infrastructure, in the cloud, a cost will be associated.
But how much will I spend? That's the thing... we don't know the amount of tracing that will be generated, especially when we use auto-instrumentation, as it will create the spans it thinks it should.
Will it send to Grafana? To Dynatrace? To Datadog? To an internal Jaeger?
If we talk about logs, we have some control, as we can define the severity level to record (INFO, WARNING, ERROR, DEBUG), but we have no control over the amount of spans that will be created.
Because of this, we need to develop a plan to ensure that the cost doesn't rise too much and that's where Sampling comes in.
There are two types of Sampling:
-
Head Sampling: An instrumentation configured in the application will decide whether we should keep the span or not.
-
Tail Sampling: The application doesn't care about this, everything will be directed to the collector and it will define whether we want to keep it or not.
When I say keep, I mean send it to be stored. We can always generate all spans, but we won't store them.
For now, we're only going to talk about Head, as we haven't used the collector yet.
In the first span generated, the parent, will make the decision whether or not to keep it and this decision needs to be propagated to all children who must respect this decision. It's the same idea as the TraceID and flags that form the trace context.
We are making a decision at the beginning without knowing what lies ahead. We don't know how it will end, whether with success or error, how long it took, etc. This decision is being made by a single time interval without considering any other.
There are 4 pre-defined samplers.
AlwaysOffSampler(All data will be discarded): Only for development and testing purposes.AlwaysOnSampler(All data will be kept): Only for development and testing purposes.ParentBasedSampler(Most used in production): Respects the decision of whoever called it. If the direct parent, not the first one, decides not to keep it then it doesn't keep it.TraceIdRatioBasedSampler(Also used in production): Gets a sample of a quantity (e.g., 50%) of the span's own data so that the decision can be made.
We can combine ParentBasedSampler and TraceIdRatioBasedSampler. If the span is the first one then it can decide, and if it's the children they will respect the parent's decision.
The sampler is also passed to the instrumenter, so let's create it. The code will be available in the project on the sampler branch.
  const sampler = new ParentBasedSampler({
    root: new TraceIdRatioBasedSampler(0.5)
  })

  const sdk = new NodeSDK({
    resource,
    traceExporter,
    instrumentations,
    sampler,
  });
-
ParentBasedSampler: This is a sampler that makes decisions based on the parent's state:
- If the span has a parent, it follows the parent's sampling decision
- If the span has no parent (it's a root span), it uses the sampler defined in root
-
TraceIdRatioBasedSampler(0.5): This is the sampler used for root spans (without parent):
- The value 0.5 means 50% sampling, that is, approximately half of the root traces will be sampled. If it were 1.0 it would be 100% of traces, 0.1 would be 10% of traces.
So, in summary, this code configures:
- For spans that have a parent: follows the parent's decision
- For root spans (without parent): samples 50% of them randomly
This would be how we would use it quickly, but we still have a problem. When we remove 50% of the data, we're basically taking the 50% most common from our traffic, which may contain things that simply don't matter. Let's test this.
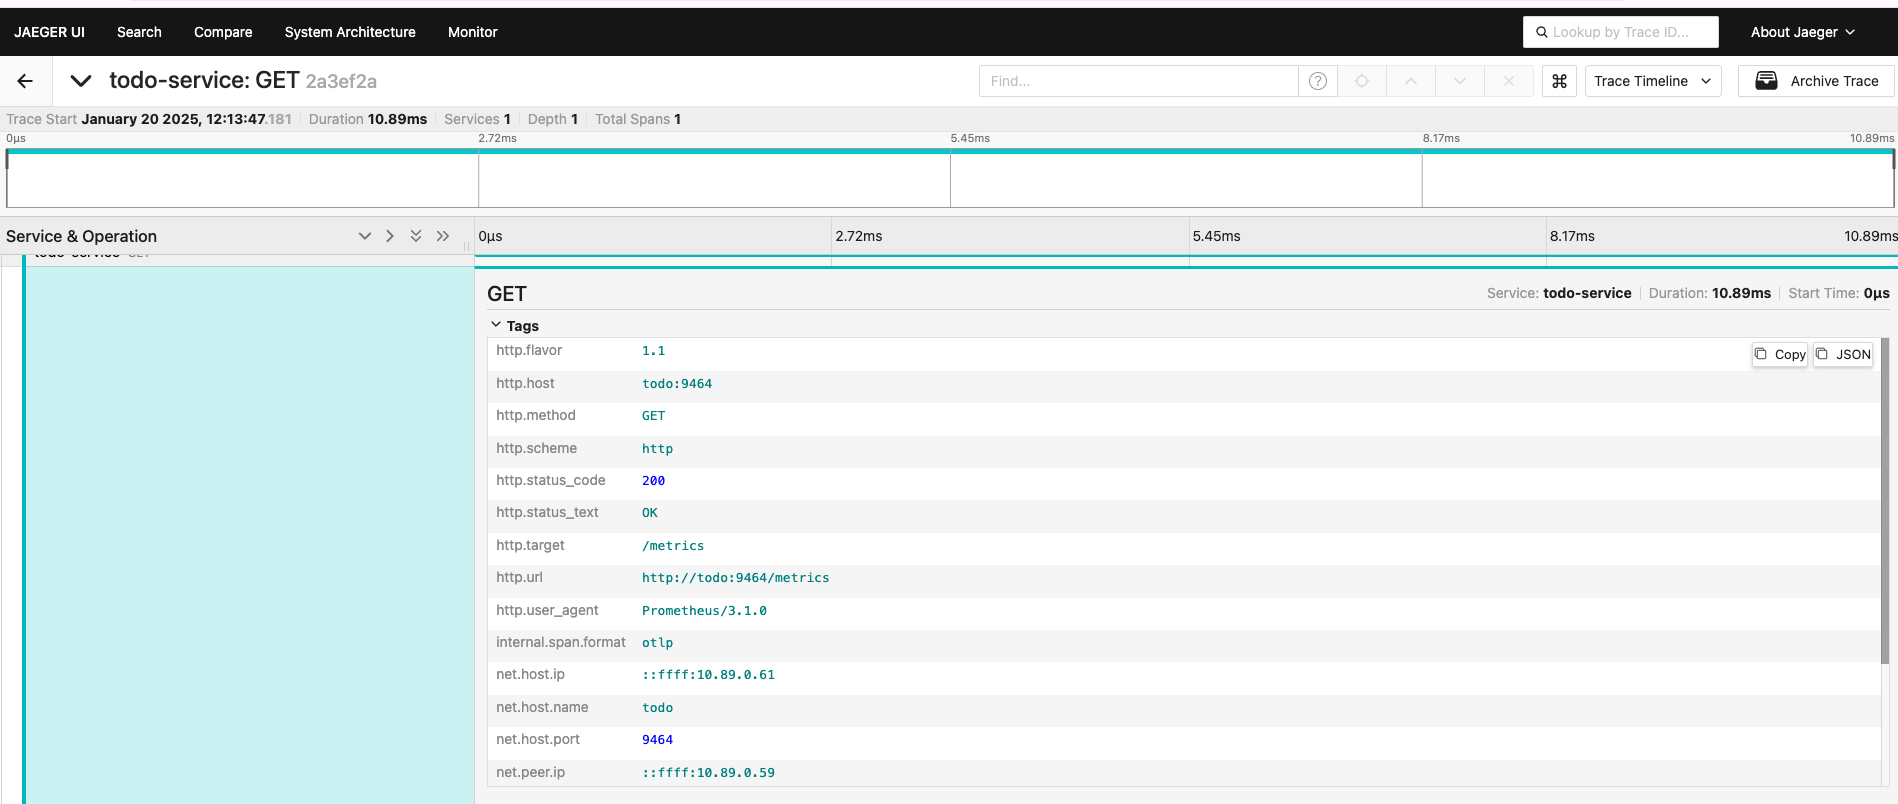
Eliminating 50% of the data, the only thing that was recorded was a GET that came from the prometheus scrape which makes no sense at all for debugging an application.
What we can do is create our own sampler that will be defined by the parent and passed to the children.
To do this now we're going to create a sampler separately which will be the customSampler.ts file and import it in our instrumentation.ts.
// Code...
import { CustomSampler } from './customSampler'
// Code...
function start(serviceName: string) {
  const sampler = new ParentBasedSampler({
    root: new CustomSampler(), // The parent will get a customized sampler.
  });

  const sdk = new NodeSDK({
    resource,
    traceExporter,
    instrumentations,
    sampler,
  });
  // Code...
}
Our customSampler.ts will be...
import { Attributes, Context, Link, SpanKind } from "@opentelemetry/api";
import { PrometheusExporter } from "@opentelemetry/exporter-prometheus";
import {
  Sampler,
  SamplingResult,
  SamplingDecision,
} from "@opentelemetry/sdk-trace-base";

// The class we're going to implement
export class CustomSampler implements Sampler {
  // Required method from the Sampler interface that decides if a specific span should be sampled or not
  shouldSample(
    context: Context,
    traceId: string,
    spanName: string,
    spanKind: SpanKind,
    attributes: Attributes,
    links: Link[]
  ): SamplingResult {
    // attributes["http.target"] contains the HTTP request path. If it's /metrics...
    if (
      attributes["http.target"] === PrometheusExporter.DEFAULT_OPTIONS.endpoint
    ) {
      // Debug log that we'll show in the console
      console.log("We won't keep it!", { attributes });
      // Returns decision to NOT record this span
      return {
        decision: SamplingDecision.NOT_RECORD,
      };
    }
    // For all other cases, returns decision to record and sample
    return {
      decision: SamplingDecision.RECORD_AND_SAMPLED,
    };
  }
}
When we run it we'll have this in the console, showing that all the gets that prometheus makes for scraping are disregarded.
auth-1        | }
todo-1        | We won't keep it! {
todo-1        |   attributes: {
todo-1        |     'http.url': 'http://todo:9464/metrics',
todo-1        |     'http.host': 'todo:9464',
todo-1        |     'net.host.name': 'todo',
todo-1        |     'http.method': 'GET',
todo-1        |     'http.scheme': 'http',
todo-1        |     'http.target': '/metrics',
todo-1        |     'http.user_agent': 'Prometheus/3.1.0',
todo-1        |     'http.flavor': '1.1',
todo-1        |     'net.transport': 'ip_tcp'
todo-1        |   }
todo-1        | }
auth-1        | We won't keep it! {
auth-1        |   attributes: {
auth-1        |     'http.url': 'http://auth:9464/metrics',
auth-1        |     'http.host': 'auth:9464',
auth-1        |     'net.host.name': 'auth',
auth-1        |     'http.method': 'GET',
auth-1        |     'http.scheme': 'http',
auth-1        |     'http.target': '/metrics',
auth-1        |     'http.user_agent': 'Prometheus/3.1.0',
auth-1        |     'http.flavor': '1.1',
auth-1        |     'net.transport': 'ip_tcp'
auth-1        |   }
auth-1        | }
todo-1        | We won't keep it!
#...
By removing some things we can reduce costs!