Collector Processor
About the processor, these are the actions we can perform when we receive telemetry data. They are optional, but some are recommended. Here we have a list of what we can do.
In the same idea of improving performance, here we have batch for batch processing. The default configuration is enough to get started and, if necessary, make adjustments.
We'll use the resource processor which applies only to the trace pipeline to include, modify or delete a resource attribute in each of the received spans.
We've already included tags in the SDK in this part of the code.
  const resource = new Resource({
    "team.ownner": "devsecops-team",
    repository: "https://gitlab.com/davidpuziol/opentelemetry-project",
    site: "https://gitlab.com/davidpuziol/opentelemetry-project",
  });
We don't need to remove it, we could have also done this in the collector or keep both if necessary. For our example, we'll keep what the SDK did, but include one and delete another created by the SDK.
#Code...

processors:
  batch: # when we don't adjust the options we're using the default values.
  resource:
    attributes:
    - key: testcollectorstudy
      value: collector_is_good
      action: insert
    - key: repository
      action: delete

#Code...

# And we'll use this processor
# Service configurations
service:
  extensions:
  - health_check
  pipelines:
    traces:
      receivers:
      - otlp
      processors:
      - batch # needs to be first
      - resource # We'll include that attribute
      exporters:
      - otlphttp
    metrics:
      receivers:
      - otlp
      processors:
      - batch # Here I'll only use batch
      exporters:
      - prometheus
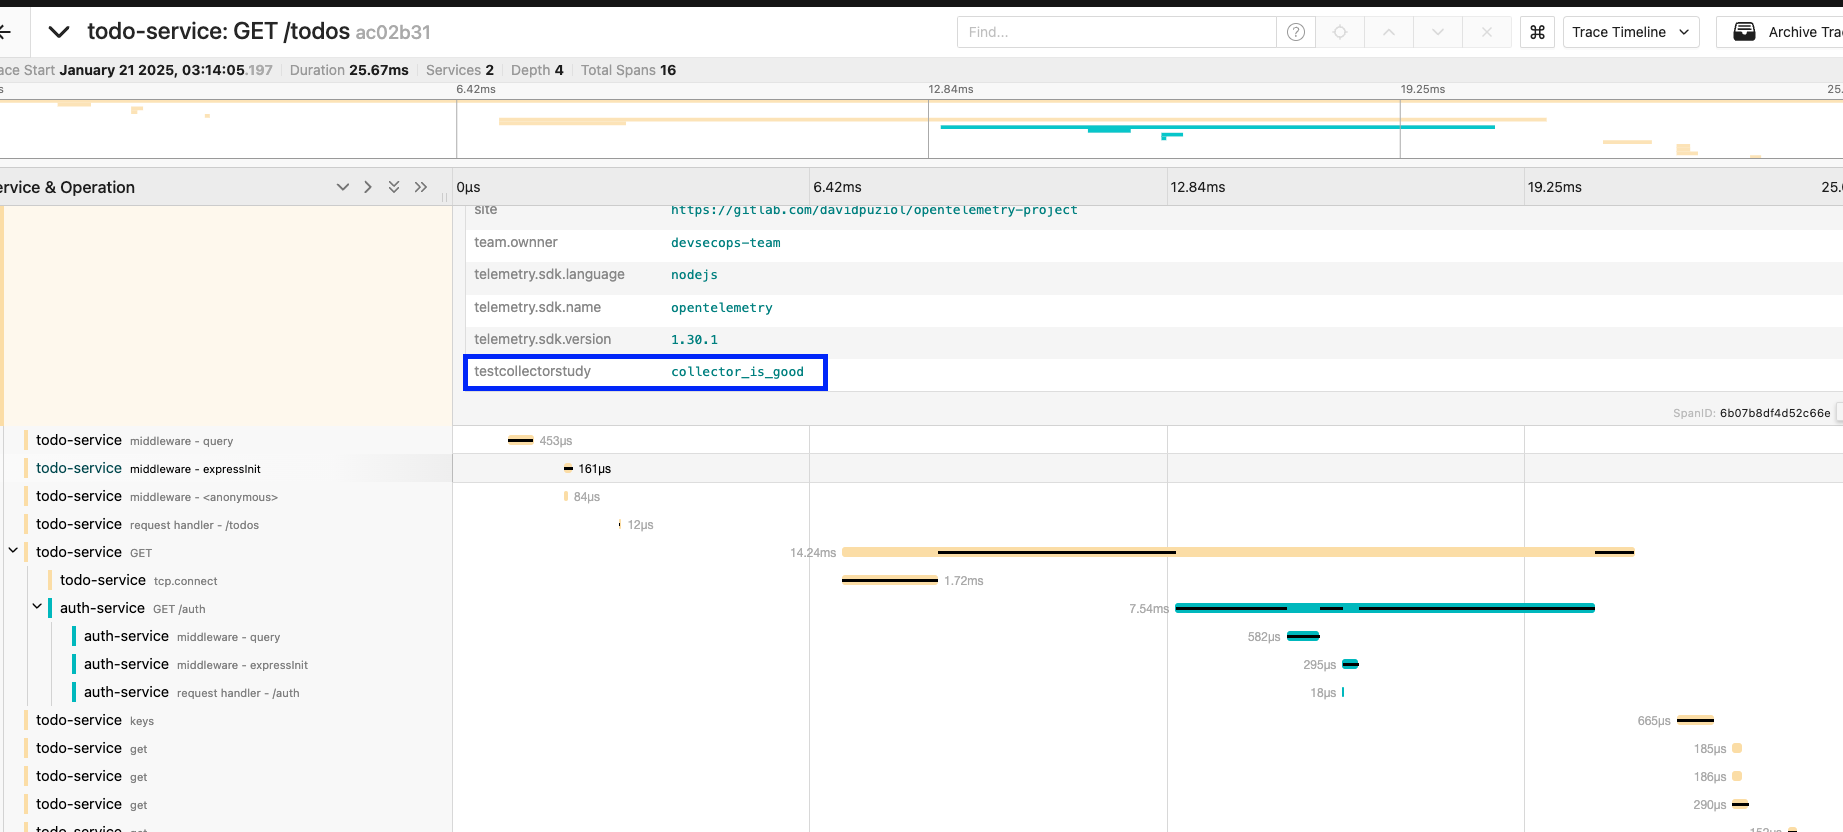
Checking Jaeger after a curl to localhost:8081/todos, we can see the inclusion of this attribute.
The repository tag was eliminated, but I forgot to mark it. I did this because I had duplicate values.
In the same idea, we have the sampler to make a decision about what we should keep or not, but now we have more power compared to when we use the SDK. Unlike the SDK, now we're going to make the decision to keep the sample or not at the end of the process and not at the beginning of it, that's why we call it Tail Sampling.
Let's apply it to our code and eliminate the Head Sampler from our code.
// import { ParentBasedSampler, TraceIdRatioBasedSampler } from "@opentelemetry/sdk-trace-node";
// import { CustomSampler } from './customSampler'

//code..

function start(serviceName: string) {

//code..

 // const sampler = new ParentBasedSampler({
  //   root: new CustomSampler(),
  // });

  const sdk = new NodeSDK({
    resource,
    traceExporter,
    instrumentations,
    // sampler,
  });
}
We'll only keep the sample if it satisfies any of the rules.
# Code...

processors:
  batch:
  resource:
    attributes:
    - key: testcollectorstudy
      value: collector_is_good
      action: insert
  tail_sampling:
    # Wait time to receive all spans of a trace before making a sampling decision
    decision_wait: 10s
    # Maximum number of traces that can be in the decision process
    num_traces: 100
    # Indicates the expectation of how many new traces arrive per second. This helps the collector prepare resources. If not passed it's 0, which means there's no expectation.
    expected_new_traces_per_sec: 10
    decision_cache:
      sampled_cache_size: 100_000 # 100 thousand traces
      non_sampled_cache_size: 100_000
    policies:
      [
          {
            name: high_latence,
            type: latency,
            latency: {threshold_ms: 500}
          },
          {
            name: http_error_only,
            type: numeric_attribute,
            numeric_attribute: {http_status_code: key1, min_value: 500, max_value: 599}
          },
      ]
# Code...

service:
  extensions:
  - health_check
  pipelines:
    traces:
      receivers:
      - otlp
      processors:
      # If you forget to use the process nothing will happen!
      - tail_sampling # We'll add before batch
      - batch
      - resource
    # Code...
# Code...
Let's then take advantage of the endpoints we have.
curl http://localhost:8081/todos
{"todos":[{"name":"Implementar tracing"},{"name":"Configurar OpenTelemetry"},{"name":"Configurar exporters"},{"name":"Adicionar métricas"}],"user":{"username":"David Prata","userId":12345}}%

curl http://localhost:8081/todos\?fail\=1
Internal Server Error

curl http://localhost:8081/todos\?slow\=1
{"todos":[{"name":"Implementar tracing"},{"name":"Configurar OpenTelemetry"},{"name":"Configurar exporters"},{"name":"Adicionar métricas"}],"user":{"username":"David Prata","userId":12345}}%
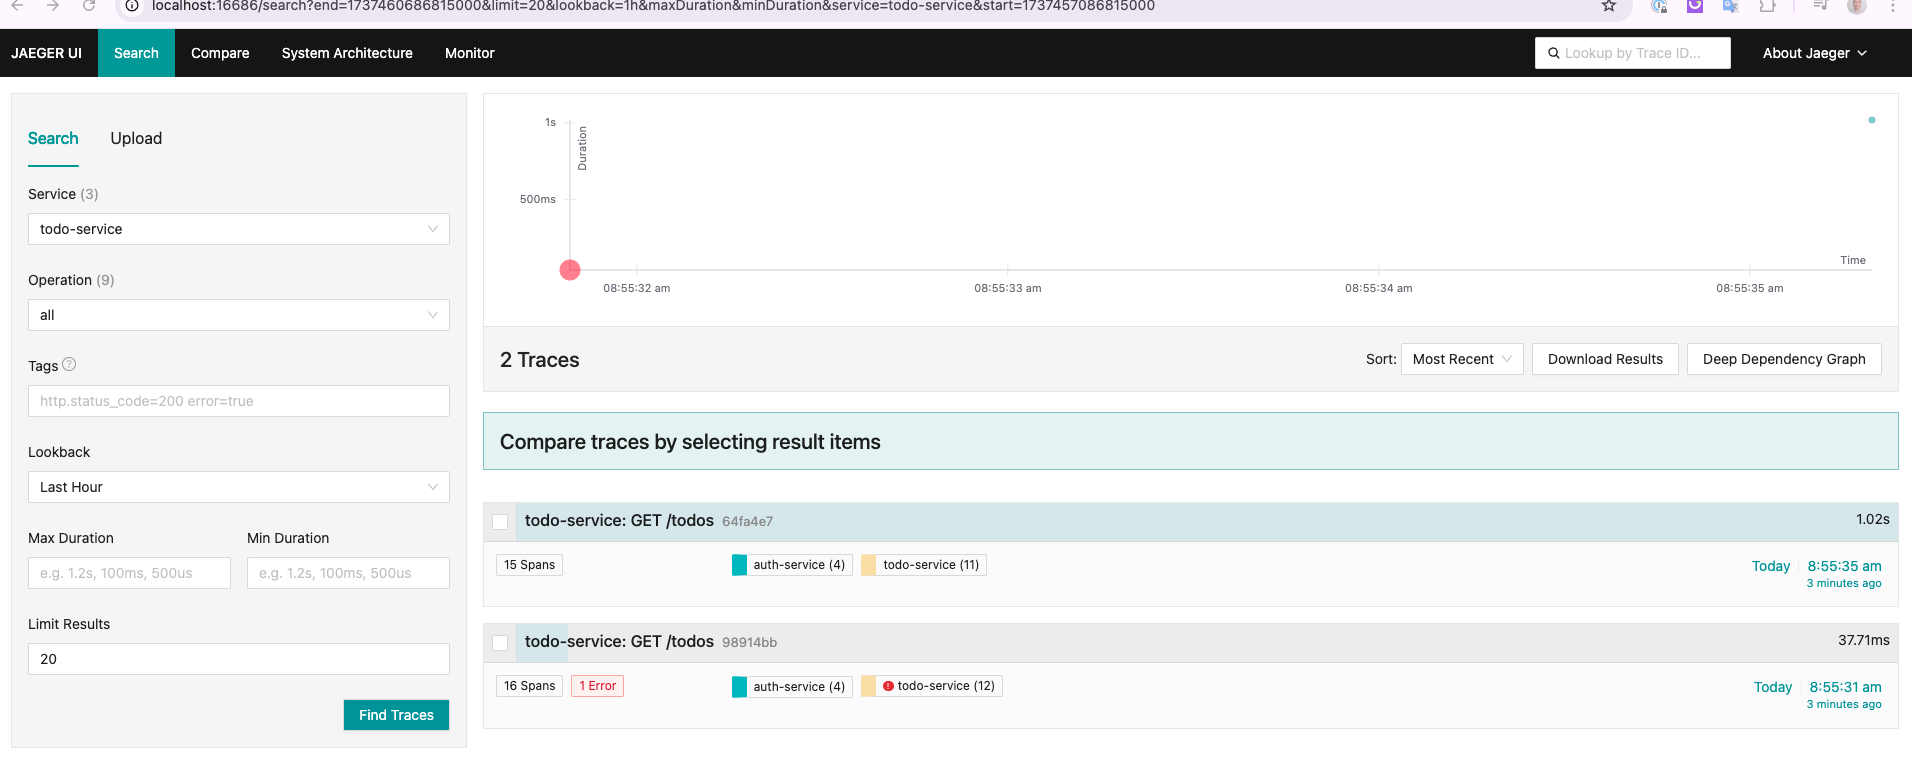
We can observe that we only have in Jaeger the requests above 500ms and with error.