First Metrics
Now let's instrument the metrics. Up to this point, we've only done the trace part.
We installed all these packages, but we haven't used all of them yet.
npm install @opentelemetry/sdk-node \
  @opentelemetry/api \
  @opentelemetry/auto-instrumentations-node \
  @opentelemetry/sdk-metrics \ ###THIS ONE
  @opentelemetry/sdk-trace-node
If we're talking about metrics, we need a tool to store the metrics, so let's add Prometheus to our stack here.
Prometheus is what scrapes the metrics that the application displays on the /metrics endpoint. So we need to configure it by pointing out which endpoints it will fetch and we need to provide the application endpoints.
Let's create a prometheus folder that will be mapped to the prometheus container at /etc/prometheus and place the prometheus.yaml file with the Prometheus configuration inside so that prometheus starts up with this configuration.
global:
  # Default is 1 minute, we'll just decrease it to make it faster
  scrape_interval: "5s"

scrape_configs:
  - job_name: 'opentelemetry'
    metrics_path: /metrics
    scheme: http
    static_configs:
    - targets:
      - todo:9464
      - auth:9464
And the project will look like this
.
├── docker
│   ├── Dockerfile.auth
│   └── Dockerfile.todo
├── docker-compose.yml
├── package-lock.json
├── package.json
├── prometheus
│   └── prometheus.yaml
├── src
│   └── services
│       ├── auth-service.ts
│       ├── instrumentation.ts
│       └── todo-service.ts
└── tsconfig.json

5 directories, 10 files
Our docker-compose will look like this.
version: '3.8'

services:

  auth:
    build:
      context: .
      dockerfile: docker/Dockerfile.auth
    volumes:
      - .:/usr/src/app:rw
      - /usr/src/app/node_modules
    ports:
      - 8080:8080
      # To access the /metrics we're going to create
      - 9464:9464

  todo:
    build:
      context: .
      dockerfile: docker/Dockerfile.todo
    volumes:
      - .:/usr/src/app:rw
      - /usr/src/app/node_modules
    ports:
      - 8081:8080
      # To access the /metrics we're going to create
      - 9465:9464
    depends_on:
      - redis

  redis:
    image: redis:alpine
    ports:
      - '6380:6379'

  jaeger:
    image: jaegertracing/all-in-one
    ports:
      - 4318
      - 16686:16686
    environment:
      COLLECTOR_OTLP_ENABLED: true

  prometheus:
    image: prom/prometheus
    command:
      -  '--config.file=/etc/prometheus/prometheus.yaml'
    ports:
    # Prometheus port
      - 9090:9090
    volumes:
      - ./prometheus/:/etc/prometheus/
And now we need to make the applications expose the /metrics endpoint with various different metrics.
Let's understand a few things before continuing.
-
The meterProvider is a kind of metrics hub. The metrics within it can be sampled in multiple places at the same time. Just to emphasize, we're going to export the metrics at the same time to the /metrics endpoint generated by the prometheusExporter but also to the application console. There's also the OTLPMetricExporter to send metrics to other systems that support the OTLP protocol, such as:
- OpenTelemetry Collector
- New Relic
- Datadog
- Dynatrace
- Grafana Agent
-
Operating system metrics (CPU, memory, etc.) require special treatment. Because they need permissions to access system resources, they are collected by a separate process (HostMetrics). These metrics are configured to use the same meterProvider as the metrics destination.
/*instrumentation.ts*/
// Main OpenTelemetry imports
import { NodeSDK } from '@opentelemetry/sdk-node';  // Base SDK for Node.js
import { getNodeAutoInstrumentations } from '@opentelemetry/auto-instrumentations-node';  // Automatic instrumentation
import { OTLPTraceExporter } from '@opentelemetry/exporter-trace-otlp-proto'; // Trace exporter for Jaeger
import { metrics } from '@opentelemetry/api';
// Resources for service identification
import { Resource } from '@opentelemetry/resources'; // Will work as a label
import {
  ATTR_SERVICE_NAME,
} from '@opentelemetry/semantic-conventions';

// Components for Prometheus metrics
import { PrometheusExporter } from '@opentelemetry/exporter-prometheus'
import {
  MeterProvider,
  ConsoleMetricExporter,
  PeriodicExportingMetricReader
} from '@opentelemetry/sdk-metrics';

import { HostMetrics} from '@opentelemetry/host-metrics';

function start(serviceName: string) {
  // Define a resource with the service name - will be used for both traces and metrics
  const resource = new Resource({
    [ATTR_SERVICE_NAME]: serviceName,
  });

  // Configure the Prometheus exporter
  // - Creates a /metrics endpoint on port 9464
  // - This endpoint will be used by Prometheus to collect metrics
  const prometheusExporter = new PrometheusExporter({
    port: PrometheusExporter.DEFAULT_OPTIONS.port,
    endpoint: PrometheusExporter.DEFAULT_OPTIONS.endpoint,
  }, () => {
    console.log(
      `prometheus scrape endpoint: http://localhost:${PrometheusExporter.DEFAULT_OPTIONS.port}${PrometheusExporter.DEFAULT_OPTIONS.endpoint}`,
    );
  });

  // We create the ConsoleMetricExporter, but for it to be used in the meterProvider it needs to be in a consoleReader
  const consoleExporter = new ConsoleMetricExporter();
  const consoleReader = new PeriodicExportingMetricReader({
    exporter: consoleExporter,
    exportIntervalMillis: 10000, // Will show in console every 10 seconds
});
  // We configure the MeterProvider with both exporters
  const meterProvider = new MeterProvider({
      resource,
      readers: [prometheusExporter, consoleReader]
  });

  const hostMetrics = new HostMetrics({
    meterProvider: meterProvider,
    name: `${serviceName}-host-metrics`,
  });
  hostMetrics.start();

  // Create a meter specific for this service
  const meter = meterProvider.getMeter(serviceName);
  // Define the global MeterProvider
  metrics.setGlobalMeterProvider(meterProvider);

  // Application instrumentations
  const instrumentations = [
      getNodeAutoInstrumentations({
          // Each of these still has its own options
          '@opentelemetry/instrumentation-express': { },
          '@opentelemetry/instrumentation-ioredis': { },
          '@opentelemetry/instrumentation-http': { },
          '@opentelemetry/instrumentation-dns': { },
          '@opentelemetry/instrumentation-net': { },
          '@opentelemetry/instrumentation-fs': { }
          //
      })
  ];
  // Configure the trace exporter to send to Jaeger
  const traceExporter = new OTLPTraceExporter({
    url: 'http://jaeger:4318/v1/traces',
  });

  const sdk = new NodeSDK({
    resource,
    traceExporter,
    instrumentations
  });

  // Start the SDK - begin collecting telemetry
  sdk.start();

  // In the output we'll deliver the meter and meterProvider which will be used later to create custom metrics.
  return { meter, meterProvider }
}

export default start
We're not going to change anything in the services yet, that's a task for later.
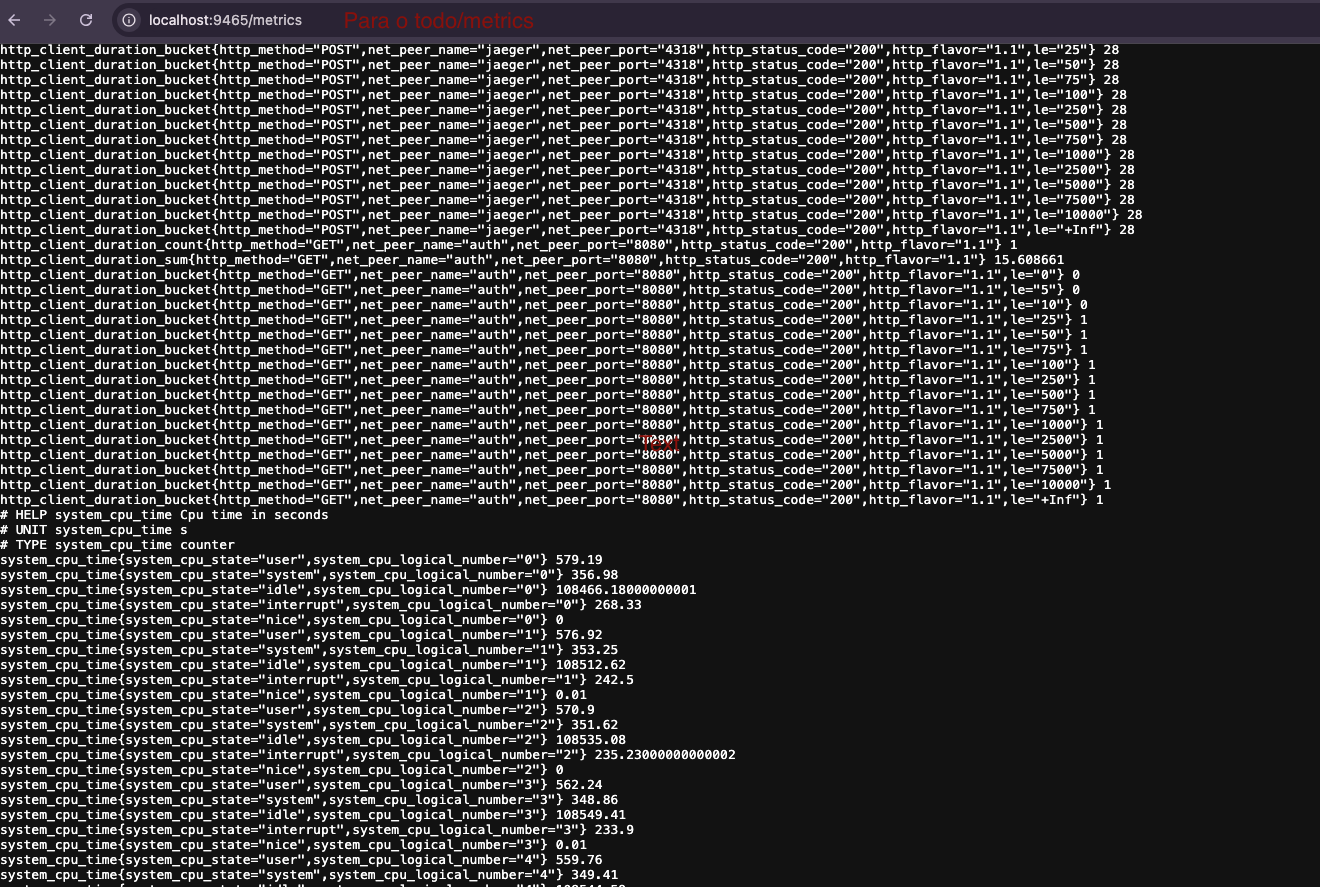
Here's a sample of /metrics for the TODO application.
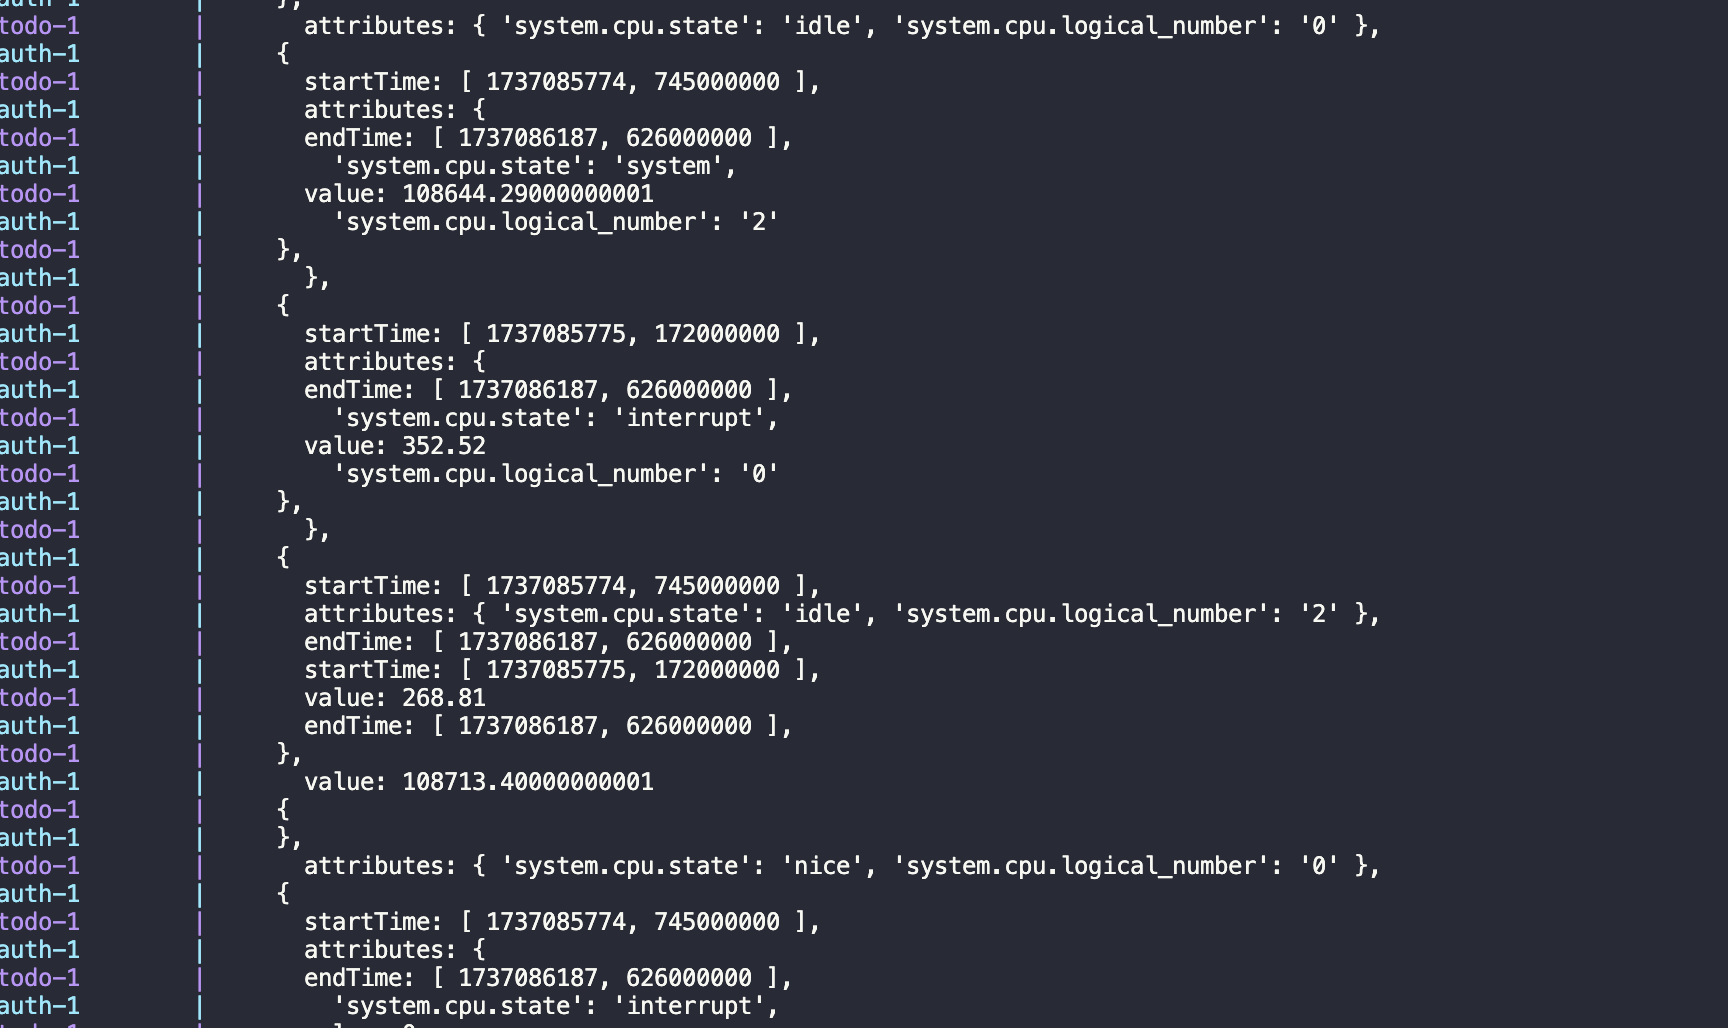
And here it's showing in the terminal as well to demonstrate that the meterProvider is publishing in two places at the same time. Obviously in production we won't do this, it doesn't even make sense.
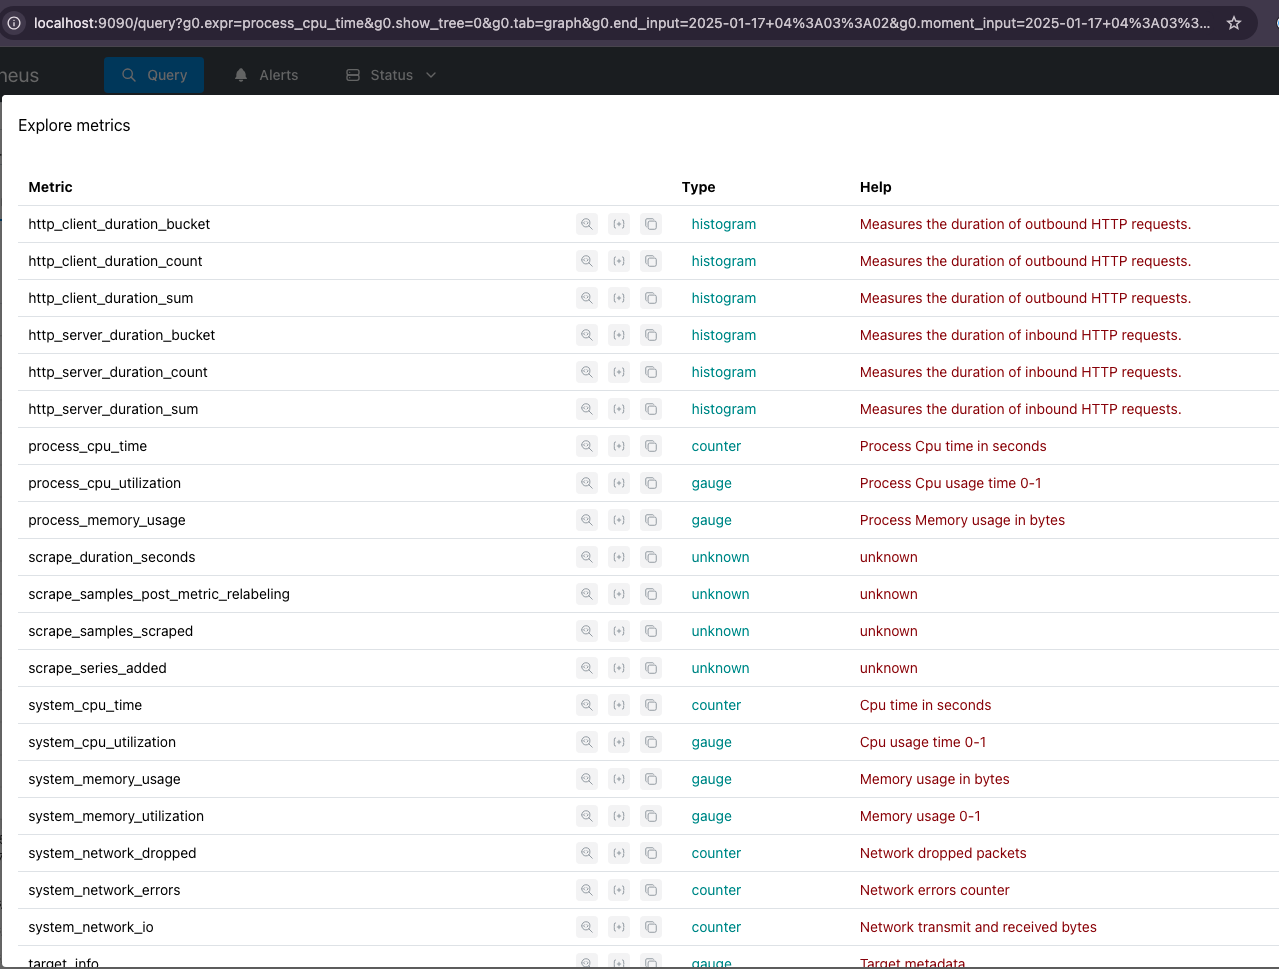
Here in prometheus we have the metrics that were exported.
Of course we're going to instrument the application according to the technology stack used. Just out of curiosity, we have several things we might want to use.
About these instrumentations we're defining below, they are automatic instrumentations for node. Inside each block of these instrumentations we have extra options that need to be studied to know what we want to enable and disable, in our case we keep everything at default.
  // Here
  const instrumentations = [
      getNodeAutoInstrumentations({
          // Each of these still has its own options
          '@opentelemetry/instrumentation-express': { },
          '@opentelemetry/instrumentation-ioredis': { },
          '@opentelemetry/instrumentation-http': { },
          '@opentelemetry/instrumentation-dns': { },
          '@opentelemetry/instrumentation-net': { },
          '@opentelemetry/instrumentation-fs': { }
          //
      })
  ];
  // ...

  const sdk = new NodeSDK({
    resource,
    traceExporter,
    instrumentations // And injecting here
  });
If a metric isn't useful to you, don't use it.
Many times it's more interesting to create our own metrics and that's what we're going to do, but first let's understand the metric types.
The code is in the otel_com_metric branch of the project.
If you want to understand a bit more in advance, check out Configuring the OTel SDK.