Reports
Let's work with reports and generate them correctly.
Most tools that perform some type of analysis can show the result in the console (terminal), but they can also generate a structured file with the analysis result, which is what we call a report.
The unit test report configuration is in the vite.config.js file
export default defineConfig({
  plugins: [react()],
  build: {
    outDir: 'build'
  },
  test: {
    environment: 'jsdom',
    setupFiles: './tests/setup.js',
    exclude: [
      '**/node_modules/**',
      '**/dist/**',
      '**/e2e/**'
    ],
    reporters: ['verbose', 'junit', 'html'], // <<<<< generating in both modes
    outputFile: {
      junit: './reports/junit.xml', // <<<<  for junit format
      html: './reports/html/index.html' // <<<< for html format
    }
  }
})
In other words, the report will be output to this file ./reports/junit.xml, although something is shown via console. This file will contain detailed information about the tests.
In our unit test job we'll generate the artifact for this report correctly. We'll use always to ensure it always gives the report, whether it fails or not.
unit-test:
  stage: test
  image: node:22-slim
  script:
    - npm ci
    - npm test
  artifacts:
    when: always
    expire_in: "1 week"
    reports:
      junit: reports/junit.xml
Let's push the code with the modification only in this job.
❯ git checkout -b pipe/reports
❯ git add .gitlab-ci.yml
❯ git commit -m "add reports to unity tests"
❯ git push origin pipe/reports
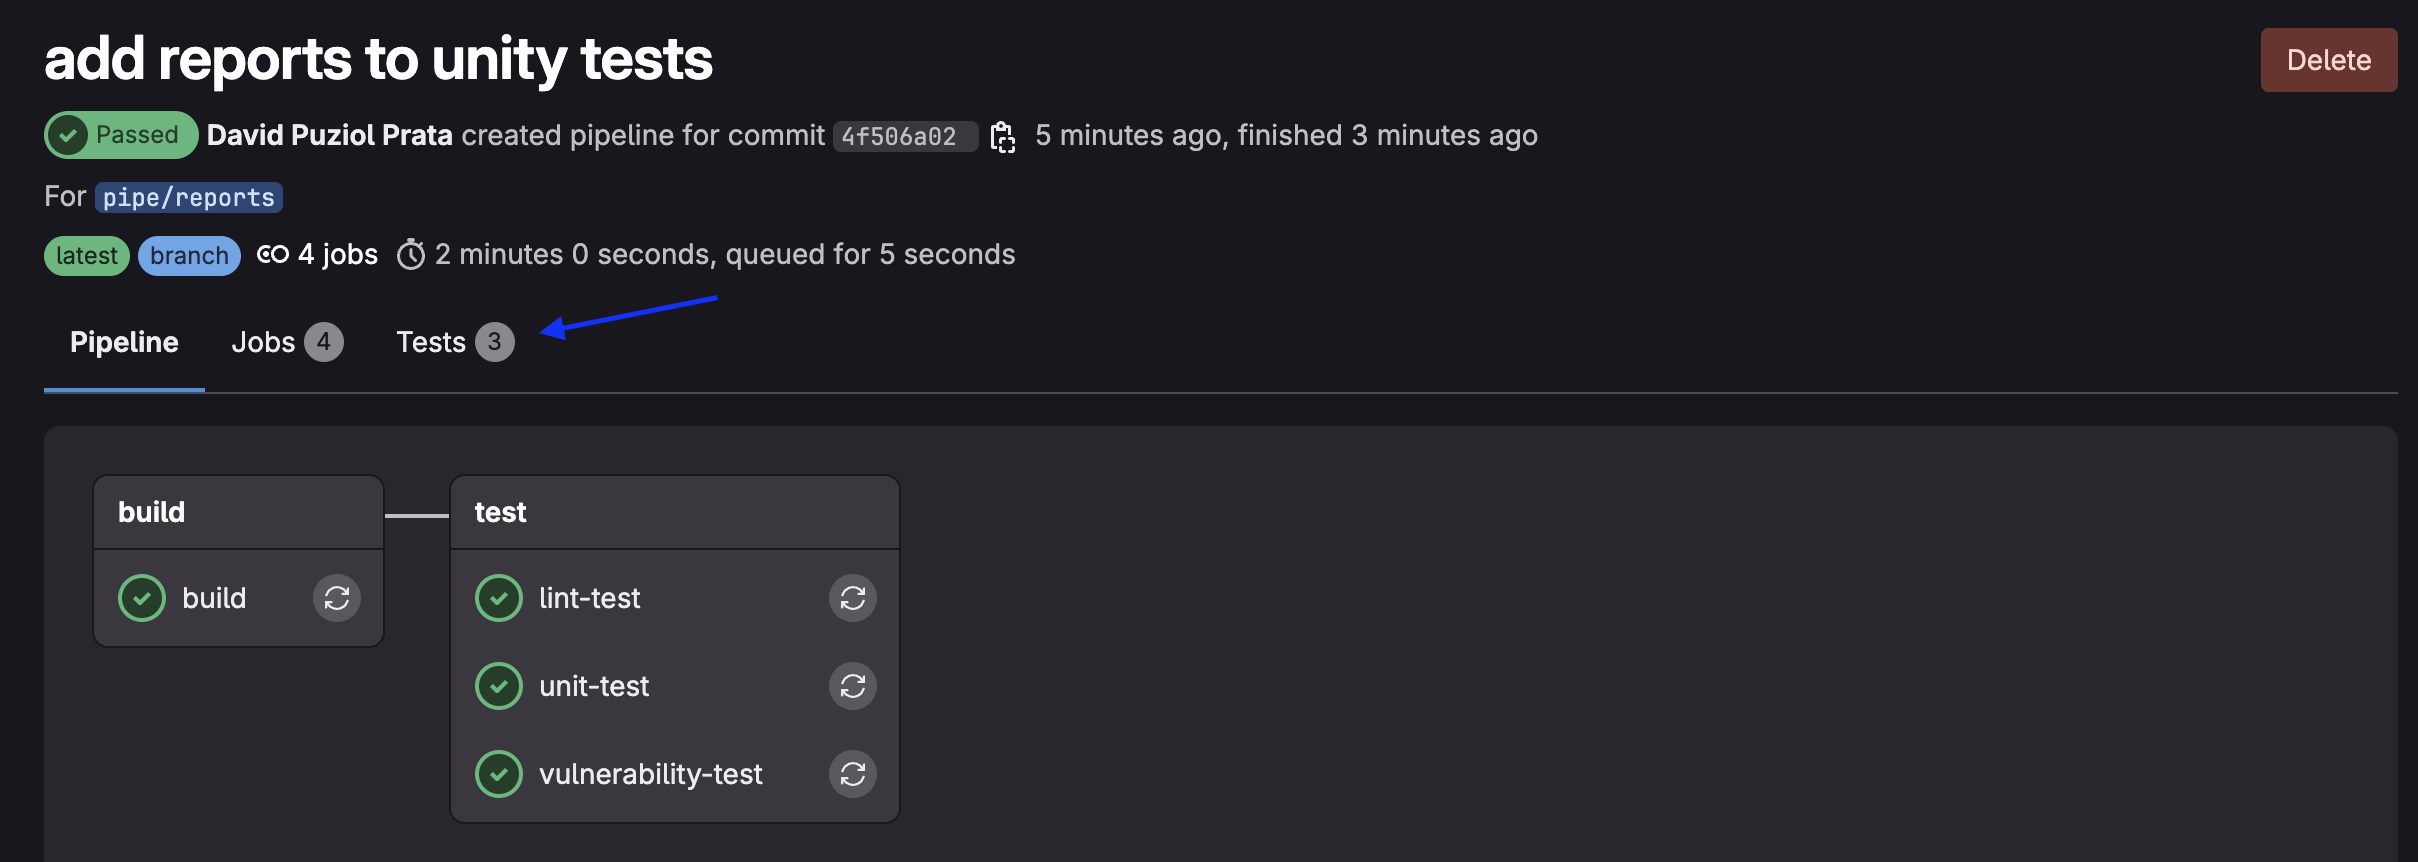
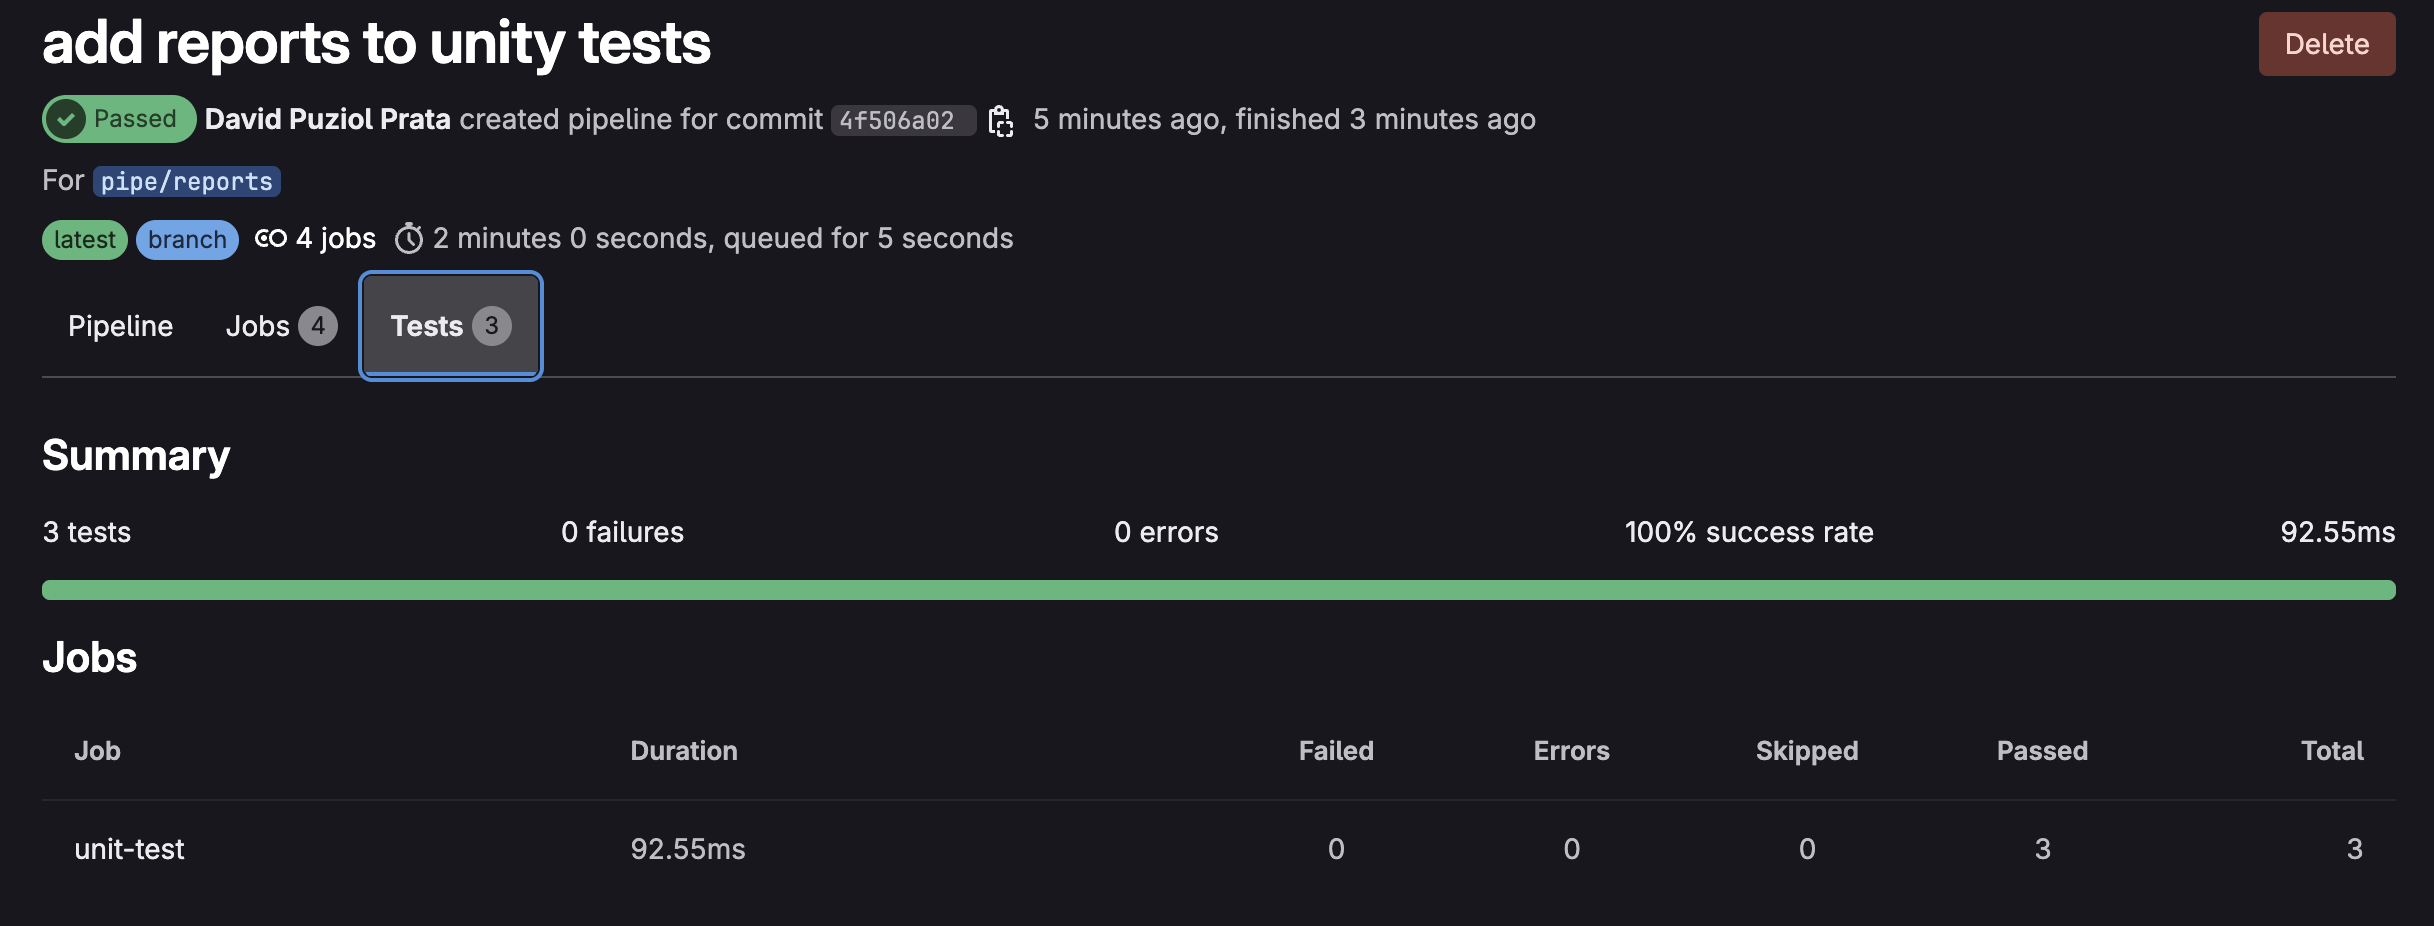
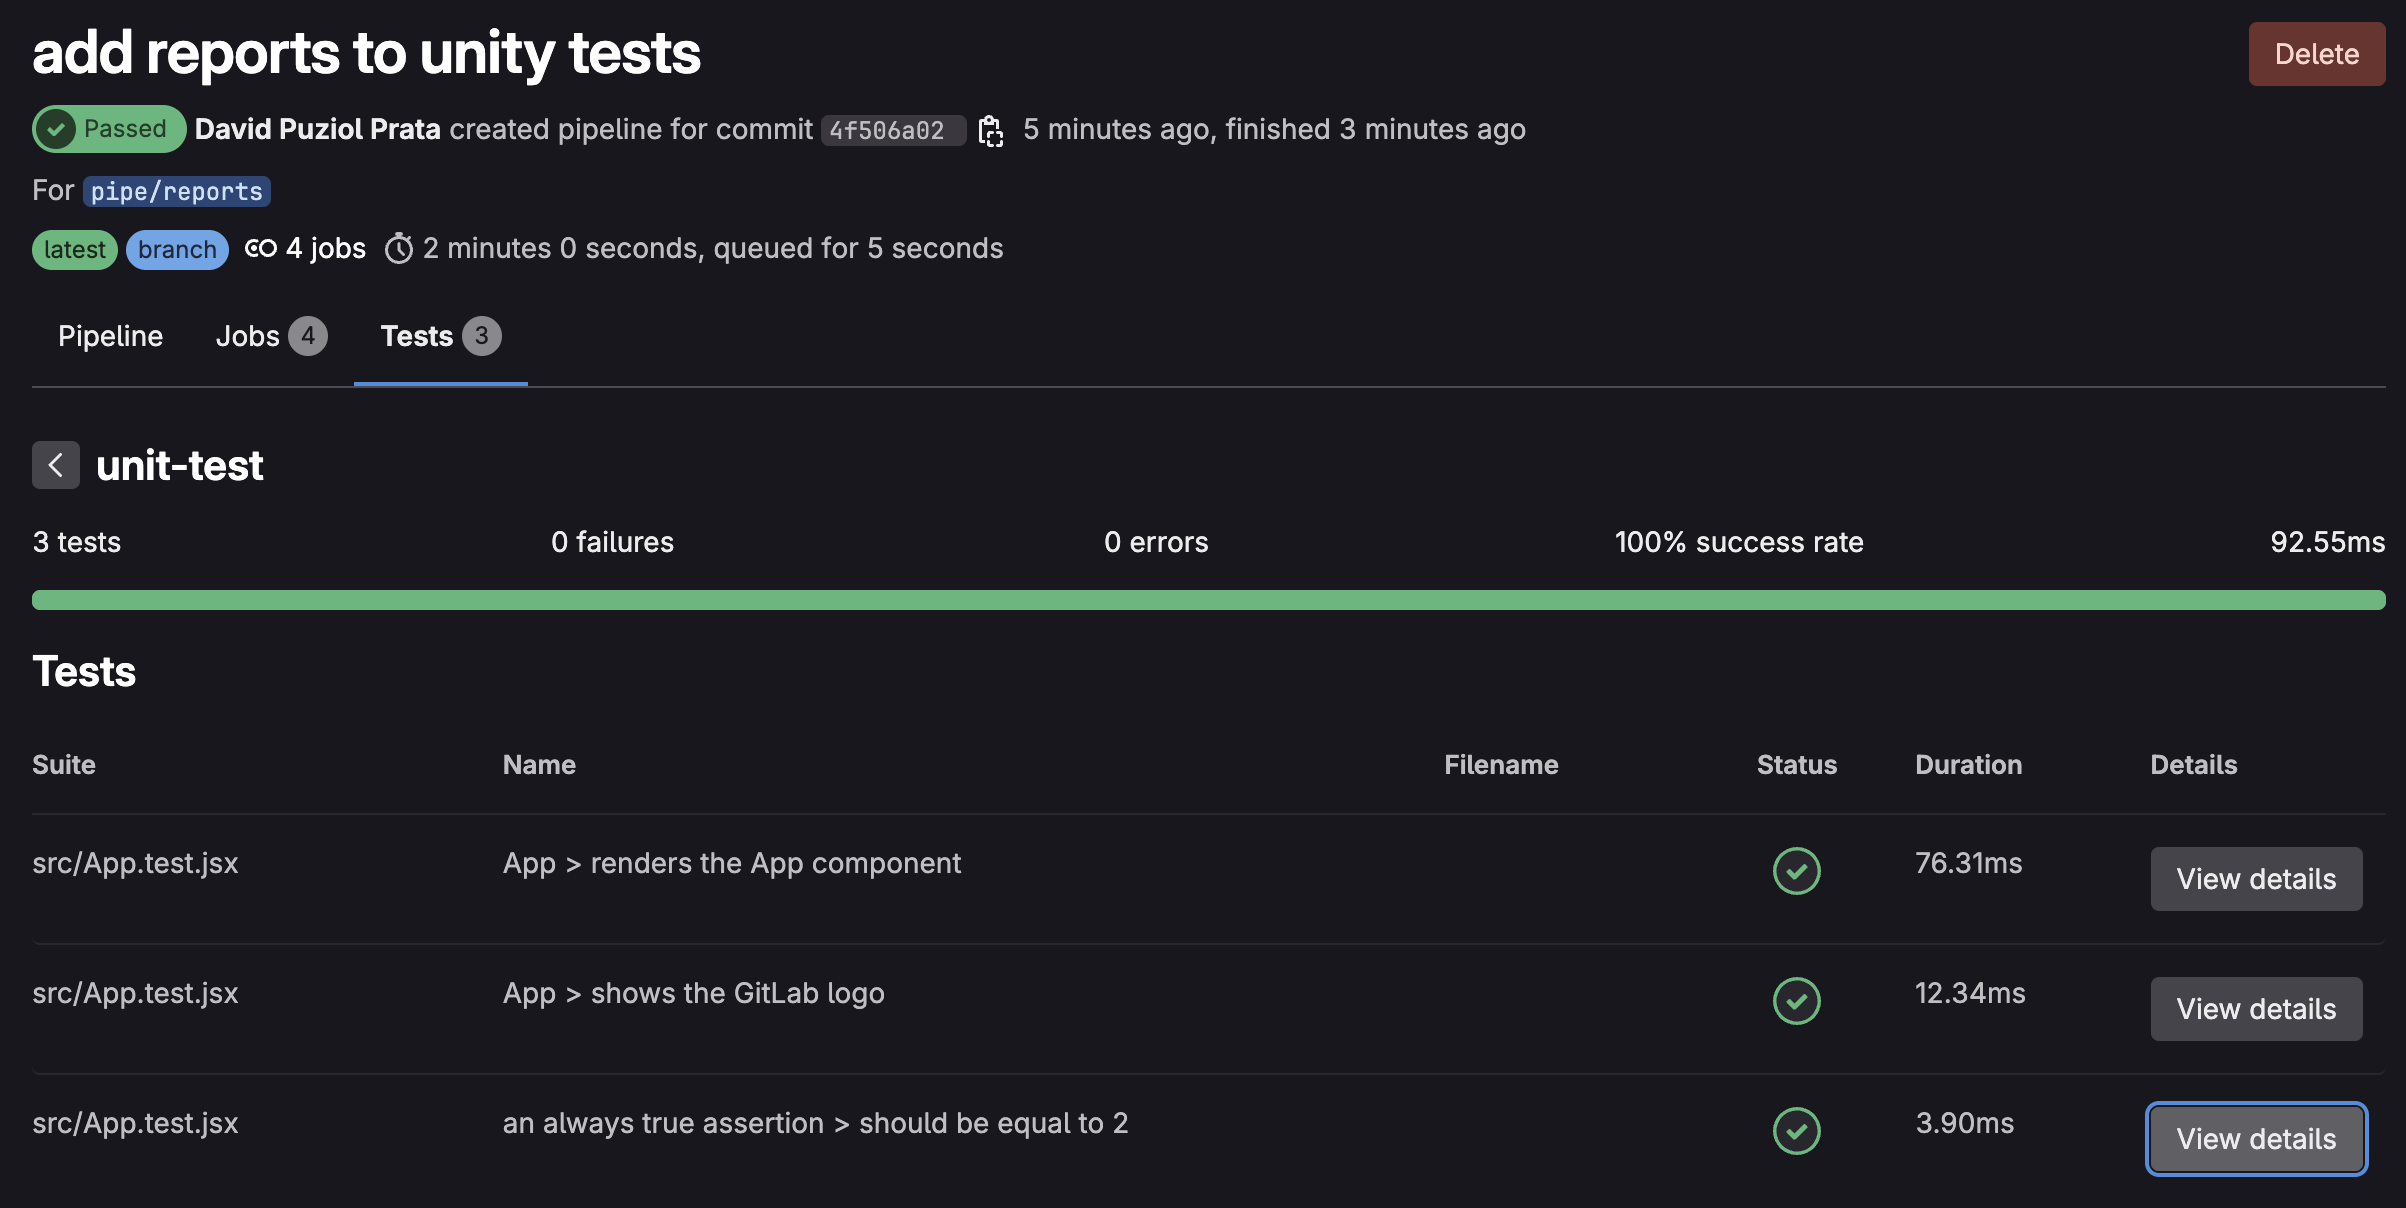
The fact that we use the junit tag (artifacts.reports.junit) tells GitLab that this is a file in junit format and automatically GitLab does a "parser" to display it correctly in the interface.
This way we can navigate through the report in a simple way and the same for various reports.
Nothing prevents us from publishing the file in reports and paths at the same time so we can download it if necessary.
How do we do the same thing now for the linter? First let's revert what we had before in package.json
{
  "scripts": {
    "lint": "eslint -f json -o gl-codequality.json .",
  },
}
Instead of plugging into junit we'll plug this into codequality. This type of test is a codequality type that we'll analyze later.
lint-test:
  stage: test
  image: node:22-slim
  script:
    - npm ci
    - npm run lint # This will call the original command
  artifacts:
    when: always
    expire_in: "3 months"
    reports:
      codequality: gl-codequality.json # we'll publish here.
❯ git add .gitlab-ci.yml
❯ git add packages.json
❯ git commit -m "add reports to linter"
❯ git push origin pipe/reports
The view is already in the push or merge itself that generated the code quality and not in the same tab where the unit tests are.
If we declare any variable that was never used it will break the pipeline in the linter, so we can test.
describe('App', () => {
  it('renders the App component', () => {
    render(<App />)
    const textElement = screen.getByText(/Learn GitLab/i);
    let myNewVar; // added
    expect(textElement).toBeInTheDocument();

    //screen.debug(); // prints out the jsx in the App component unto the command line
  })
In this case, GitLab saves the artifacts from each pipeline (like the gl-codequality.json).
When opening a Merge Request, it tries to compare the current report with that of the base branch (e.g., main) from the last valid pipeline that still has the artifact.
If the artifact has expired, there's nothing to compare - it assumes "nothing changed" or ignores the analysis. That's why it's good to keep reports for a longer time.
And what about the vulnerability-test job, what can we do with reports?
vulnerability-test:
  stage: test # same stage
  image: node:22-slim
  script:
    - npm ci
    - npm audit --audit-level=high --json > vulnerability-report.json
  artifacts:
    when: on_failure
    expire_in: "1 hour"
    paths:
      - vulnerability-report.json
Before doing this let's study a bit about reports.
Reports
To help, a bit of official reports documentation.
First let's look at the types of reports that currently exist.
-
accessibility: Automatic analysis to detect usability and digital inclusion issues in web interfaces. Tests things like: correct use of alt in images, contrast between text and background, keyboard navigation, presence of labels in inputs, semantic structure (headings, landmarks, etc) -
annotations: -
api_fuzzing: Test APIs by sending random, unexpected or malicious data to try to break, crash or exploit the application. -
browser_performance: Automatic performance report of a web page, focused on user experience (UX). Tests things like: time to first visible content (First Contentful Paint), time until page becomes interactive (Time to Interactive), frames per second, CPU/memory usage, script loading/resource weights. GitLab uses Sitespeed.io, which runs tests with Chrome in background via Puppeteer. This test only makes sense after deployment, for example in the staging or develop environment. -
coverage_report: percentage of lines/functions/blocks tested in your code. We'll implement this. -
codequality
-
container_scanning
-
coverage_fuzzing
-
cyclonedx: A standardized format to describe everything your app uses (libs, packages, versions, etc), with focus on security and compliance.
-
dast
-
dependency_scanning
-
dotenv
-
junit
-
load_performance
-
metrics
-
requirements
-
sast
-
secret_detection
-
terraform
GitLab understands various types of reports to display beautiful visual results in MRs, pipelines and Security Dashboards.
Each type has its specific JSON format.
coverage_report
To implement the coverage test in the project we'll change the following in the vite.config.js file and add the block below.
    environment: "jsdom",
    setupFiles: "./tests/setup.js",
    exclude: ["**/node_modules/**", "**/dist/**", "**/e2e/**"],
    reporters: ["verbose", "junit", "html"],
    coverage: { ## The coverage block
      provider: "istanbul",
      reporter: ["text", "json", "html", "cobertura"],
    },
    outputFile: {
      junit: "./reports/junit.xml",
      html: "./reports/html/index.html",
    }
And in package.json we'll add to scripts
  "scripts": {
    "dev": "vite",
    "build": "vite build",
    "test": "vitest",
    "e2e": "npx playwright test",
    "lint": "eslint --format gitlab .",
    "preview": "vite preview",
    "coverage": "vitest run --coverage" //This line
  },
Add the coverage folder to .gitignore otherwise it will push the local folder.
echo "coverage" >> .gitignore
To test locally execute.
❯ npm test -- --coverage

# Removed part to facilitate reading

 Test Files  1 passed (1)
      Tests  3 passed (3)
   Start at  07:18:28
   Duration  8.09s (transform 83ms, setup 168ms, collect 83ms, tests 27ms, environment 405ms, prepare 48ms)

 % Coverage report from istanbul
--------------------------------------|---------|----------|---------|---------|-------------------
File                                  | % Stmts | % Branch | % Funcs | % Lines | Uncovered Line #s
--------------------------------------|---------|----------|---------|---------|-------------------
All files                             |       0 |        0 |    0.02 |    2.22 |
 learn-gitlab-app                     |       0 |        0 |     100 |       0 |
  playwright.config.cjs               |       0 |        0 |     100 |       0 | 2-13
 learn-gitlab-app/build/assets        |       0 |        0 |       0 |       0 |
  index-BcKvuBhg.js                   |       0 |        0 |       0 |       0 | 1-40
 learn-gitlab-app/reports/html/assets |       0 |        0 |       0 |       0 |
  index-Cv3XDLXs.js                   |       0 |        0 |       0 |       0 | 1-52
 learn-gitlab-app/src                 |      50 |      100 |     100 |      50 |
  App.jsx                             |     100 |      100 |     100 |     100 |
  main.jsx                            |       0 |      100 |     100 |       0 | 6
--------------------------------------|---------|----------|---------|---------|-------------------
When we execute this test, everything will be inside the coverage folder and the file we're interested in is cobertura-coverage.xml which is a format that GitLab understands.
Now we want this in the report so let's add one more job in the test stage inside .gitlab-ci.yml.
coverage-test:
  stage: test
  image: node:22-slim
  script:
    - npm ci
    - npm test -- --coverage
  artifacts:
    when: always
    expire_in: "1 hour"
    reports:
      coverage_report:
        coverage_format: cobertura
        path: coverage/cobertura-coverage.xml
During learning we'll check more tests, don't worry about it now, the important thing is to know things and know what we can do.
Code Quality Report (codequality)
The Code Quality Report in GitLab displays directly in the Merge Request all issues found in the code, such as:
That's why we couldn't see what we did in the linter, because we weren't in a merge request. We'll do this later.
- Duplicate code
- Bad practices
- Style violations
- Potential bugs (like missing await)
It helps automate code review and enforce minimum quality in the CI/CD pipeline.
GitLab expects a specific JSON file, with each issue described in a standardized structure.
It's not just any JSON: it has to follow the GitLab CodeQuality Schema exactly! We won't stop to see this schema, let the tools and those who develop them do it. That's why we passed --format gitlab earlier.
Several tools do this, what we need to know is how to create a json file in the correct format.
- Lint / Code Quality: ESLint, Stylelint, Pylint, Flake8, GolangCI-Lint, Rubocop, PHP_CodeSniffer, SwiftLint, ktlint, TFLint, Dockerfilelint, Hadolint, ShellCheck, markdownlint
Security (SAST / Static Analysis): Bandit, Brakeman, Semgrep, ESLint-plugin-security, Gosec, NodeJsScan, Safety, Trivy
Deep Analysis / Code Smells: SonarQube, SonarCloud, CodeClimate, DeepSource, Codacy
IaC / Cloud / Containers: KubeLinter, Checkov, TFSec, CFN-Nag, Conftest
Licensing / Dependency Vulnerabilities: npm audit, yarn audit, Snyk, OWASP Dependency-Check
artifacts:
  reports:
    codequality: path/to/report.json
SAST Report (sast)
Static Application Security Testing (code vulnerabilities).
Used in Security Dashboard.
Example: Trivy, GitLab SAST scanners (Node.js, Python, etc).
artifacts:
  reports:
    sast: path/to/sast-report.json
Dependency Scanning (dependency_scanning)
Scans dependencies (package.json, pom.xml...) for CVEs.
It's like npm audit, but compatible with GitLab Security.
artifacts:
  reports:
    dependency_scanning: path/to/report.json
Container Scanning (container_scanning)
Looks for vulnerabilities in Docker images.
Uses scanners like Trivy, Grype, Clair.
Artifacts:
artifacts:
  reports:
    container_scanning: path/to/report.json
DAST Report (dast)
Dynamic Application Security Testing.
Scans the running app (not the code).
Example: OWASP ZAP.
artifacts:
  reports:
    dast: path/to/report.json
Terraform Reports (terraform)
Shows infrastructure changes detected in Terraform.
Infrastructure as code visible in MRs.
artifacts:
  reports:
    terraform: path/to/terraform-report.json
Tip
If you noticed well, all the tests here were executed in parallel - if one fails it will break the test stage. We did this to gain speed. There's no execution order. Be careful with jobs that run in parallel as sometimes it gets more complicated to debug where the problem occurred.